Thi Qar
ThiQar Governorate Land Cover and Land Degradation Profile (2000–2020)
This report summarizes land-cover conditions in ThiQar Governorate for 2000 and 2020, quantifies land-cover transitions over the 20-year period, and interprets land degradation status and types according to the UNCCD SDG 15.3.1 land-cover change framework. All statistics are derived from the GLCLU v2 (90 m) land-cover dataset aggregated to the ThiQar administrative boundary.
Total governorate area analyzed: 13,293.62 km².
2. Land cover status in 2000
2.1 Overall composition
- Low-Density Grassland: 5,121.62 km² (38.53%).
- Desert: 4,071.25 km² (30.63%).
- Cropland: 1,123.11 km² (8.45%).
- Wetlands (all wetland classes combined): 1,690.75 km² (12.72%).
- Water bodies: 138.70 km² (1.04%).
- Built-up areas: 92.64 km² (0.70%).
2.2 Spatial pattern
The 2000 land-cover map indicates a landscape structured around rangelands, desert surfaces, and extensive wetland systems. Vegetation and cropland are concentrated along river and canal networks and in lowland wetland complexes, while desert and sparse rangelands dominate drier zones.
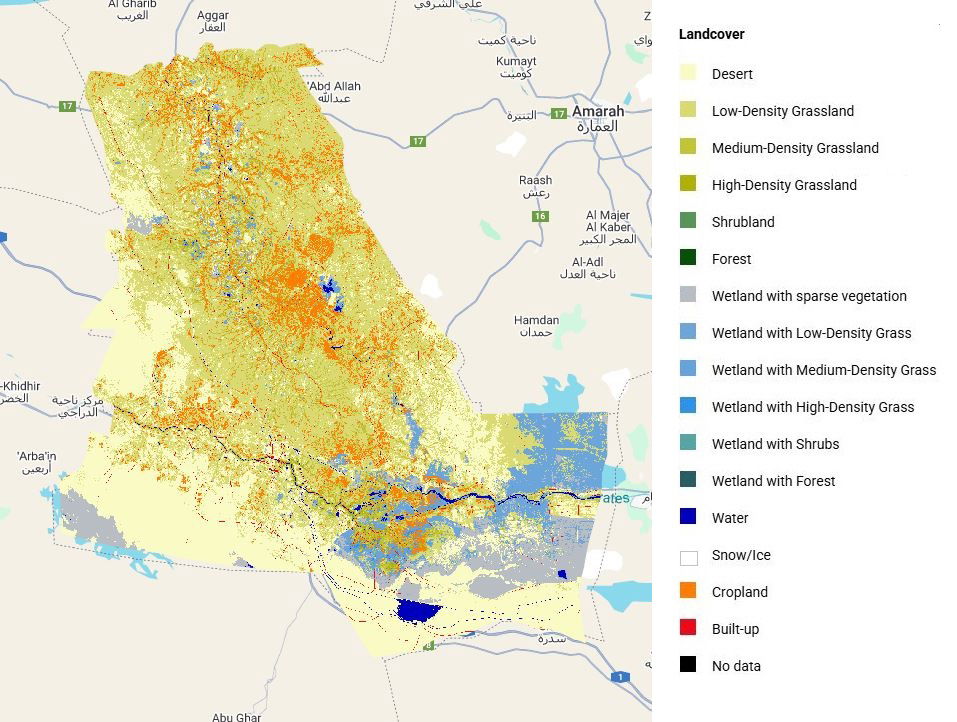
Figure 1. Land cover map of ThiQar Governorate in 2000 (GLCLU v2, Full Resolution: LC 2000 map.JPG).
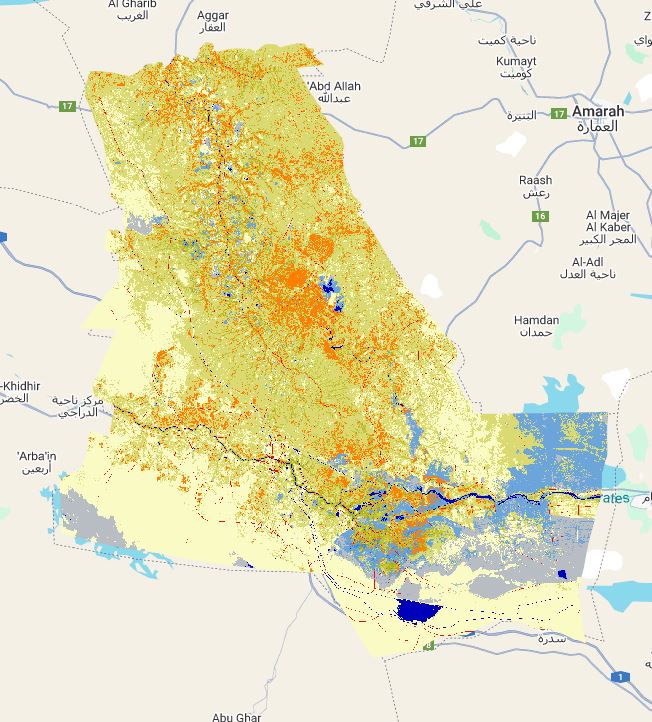

Figure 2. Land cover composition of ThiQar Governorate in 2000 (area in km² by class). Full Reoslution: .LC 2000 chart.png
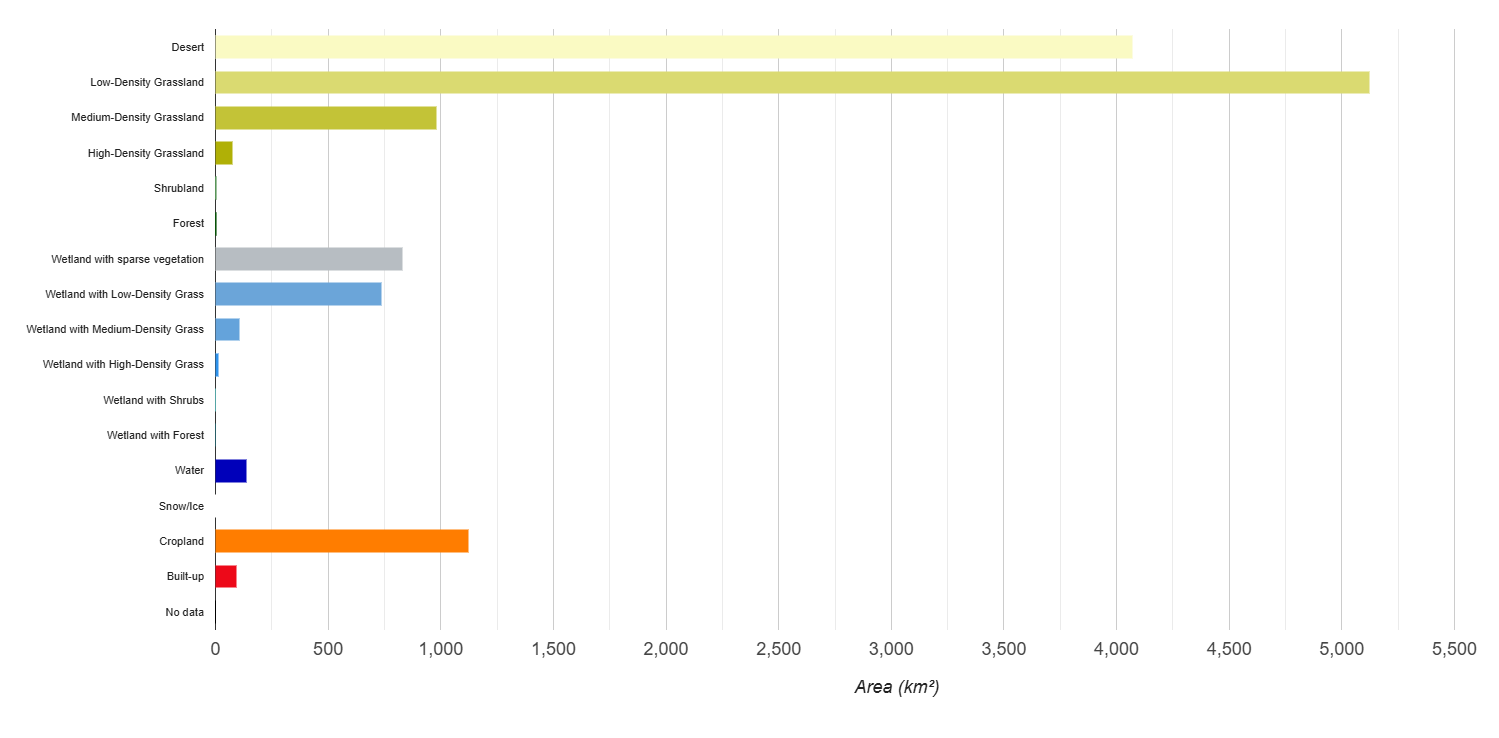
Table 1. Area of land cover classes in ThiQar Governorate in 2000.
Class | Area (km²) | Share (%) |
Desert | 4,071.25 | 30.63 |
Low-Density Grassland | 5,121.62 | 38.53 |
Medium-Density Grassland | 979.17 | 7.37 |
High-Density Grassland | 75.65 | 0.57 |
Shrubland | 0.38 | 0.00 |
Forest | 0.35 | 0.00 |
Wetland with sparse vegetation | 829.13 | 6.24 |
Wetland with Low-Density Grass | 738.87 | 5.56 |
Wetland with Medium-Density Grass | 107.81 | 0.81 |
Wetland with High-Density Grass | 14.94 | 0.11 |
Wetland with Shrubs | 0.00 | 0.00 |
Wetland with Forest | 0.00 | 0.00 |
Water | 138.70 | 1.04 |
Snow/Ice | 0.00 | 0.00 |
Cropland | 1,123.11 | 8.45 |
Built-up | 92.64 | 0.70 |
No data | 0.00 | 0.00 |
(Download: LC 2000 stats.csv )
3. Land cover status in 2020
3.1 Overall composition
- Cropland: 2,130.91 km² (16.03%).
- Low-Density Grassland: 3,754.90 km² (28.25%).
- Desert: 3,746.54 km² (28.18%).
- Water bodies: 1,472.39 km² (11.08%).
- Wetlands (all wetland classes combined): 561.99 km² (4.23%).
- Built-up areas: 320.92 km² (2.41%).
Relative to 2000, ThiQar shows strong growth in open water and cropland, alongside a marked decline in wetland classes dominated by sparse or low-density vegetation. These shifts indicate major hydrological and land-use dynamics affecting lowland systems.
3.2 Spatial pattern
The 2020 map shows expanded water surfaces and more extensive cropland footprints in lowland areas and along the main river/canal networks. Wetland classes with sparse and low-density vegetation are substantially reduced in extent, while some locations show increased vegetation density.
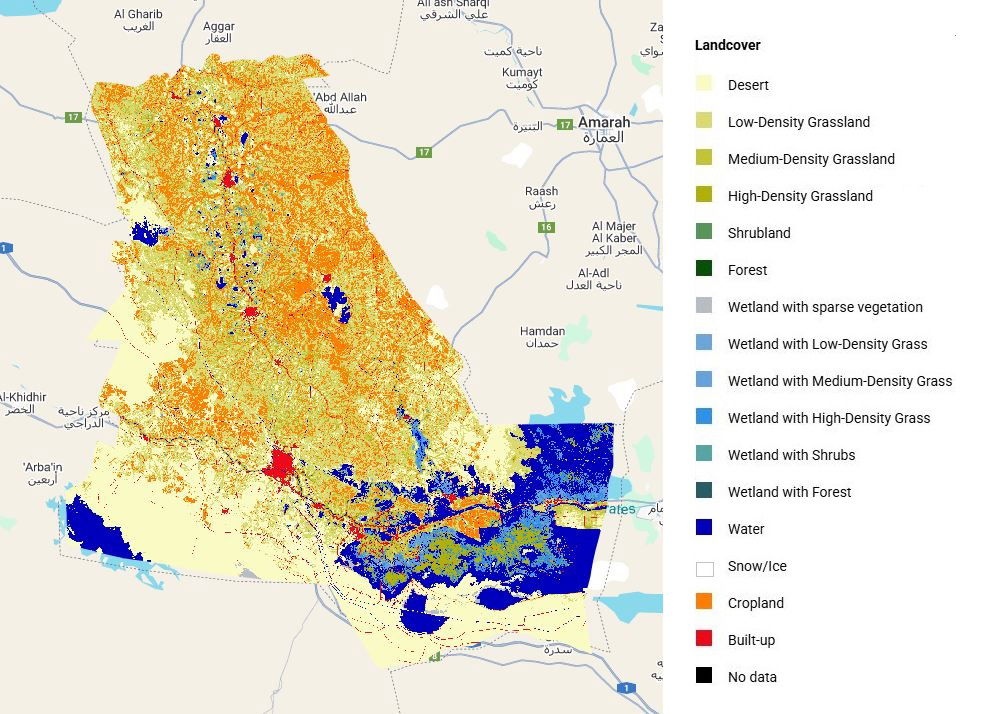
Figure 3. Land cover map of ThiQar Governorate in 2020 (GLCLU v2, Full Resolution: LC 2020 map.JPG).
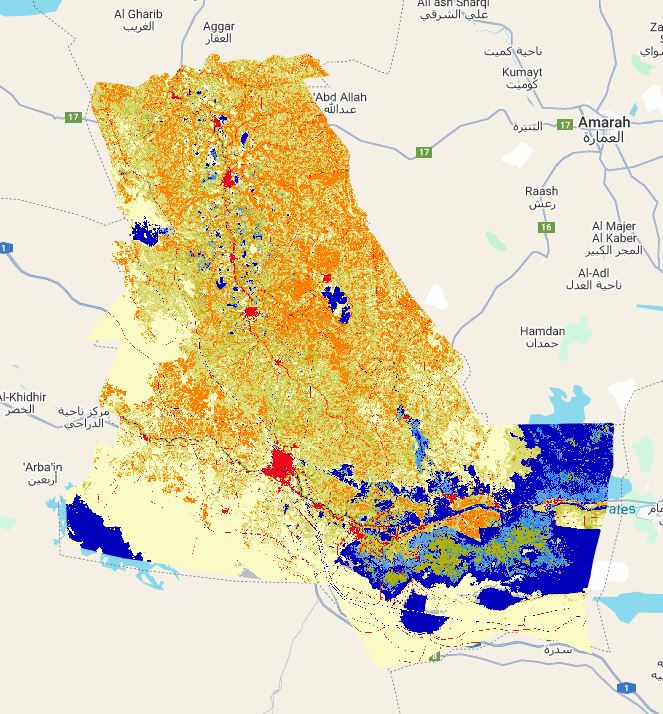

Figure 4. Land cover composition of ThiQar Governorate in 2020 (area in km² by class). Full Resolution: (LC 2020 chart.png)
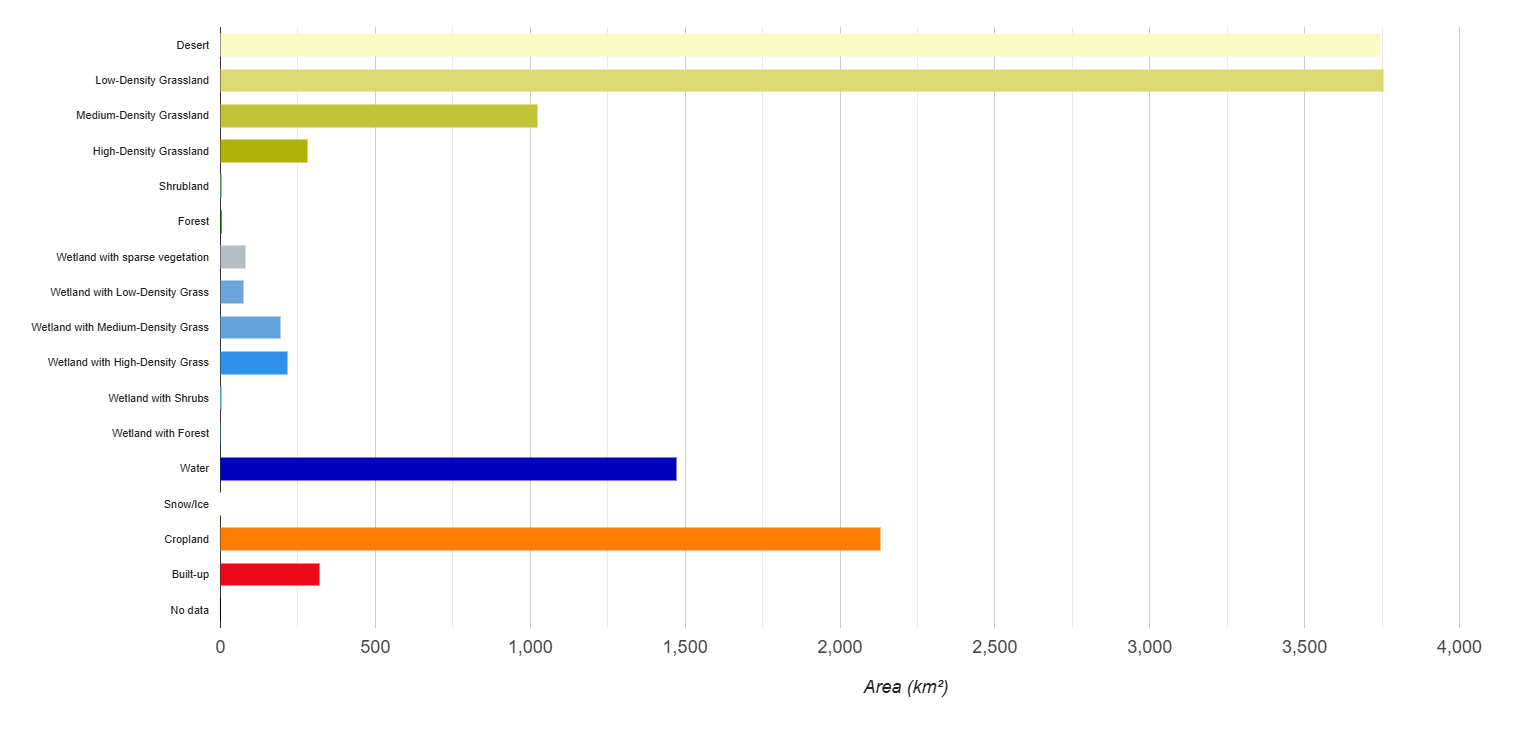
Table 2. Area of land cover classes in ThiQar Governorate in 2020.
Class | Area (km²) | Share (%) |
Desert | 3,746.54 | 28.18 |
Low-Density Grassland | 3,754.90 | 28.25 |
Medium-Density Grassland | 1,023.31 | 7.70 |
High-Density Grassland | 281.37 | 2.12 |
Shrubland | 0.44 | 0.00 |
Forest | 0.86 | 0.01 |
Wetland with sparse vegetation | 79.79 | 0.60 |
Wetland with Low-Density Grass | 73.57 | 0.55 |
Wetland with Medium-Density Grass | 193.19 | 1.45 |
Wetland with High-Density Grass | 215.41 | 1.62 |
Wetland with Shrubs | 0.01 | 0.00 |
Wetland with Forest | 0.00 | 0.00 |
Water | 1,472.39 | 11.08 |
Snow/Ice | 0.00 | 0.00 |
Cropland | 2,130.91 | 16.03 |
Built-up | 320.92 | 2.41 |
No data | 0.00 | 0.00 |
(Download: LC 2020 stats.csv)
4. Land-cover change (2000–2020)
4.1 Overall magnitude of change
Approximately 4,881.76 km² of ThiQar (36.72%) experienced a land-cover class change between 2000 and 2020. Conversely, about 8,411.86 km² (63.28%) remained stable.
4.2 Dominant transitions
The transition matrix indicates that change is dominated by conversion of grasslands to cropland and wetland-to-water transitions, consistent with agricultural expansion and strong hydrological dynamics.
Table 3. Major land cover transitions in ThiQar Governorate, 2000–2020 (top 10 by area).
From (2000) | To (2020) | Area (km²) |
Low-Density Grassland | Cropland | 877.18 |
Wetland with sparse vegetation | Water | 645.45 |
Wetland with Low-Density Grass | Water | 450.86 |
Low-Density Grassland | Medium-Density Grassland | 432.43 |
Low-Density Grassland | Desert | 288.36 |
Desert | Low-Density Grassland | 231.97 |
Medium-Density Grassland | Cropland | 226.51 |
Desert | Cropland | 172.81 |
Medium-Density Grassland | Low-Density Grassland | 153.57 |
Cropland | Low-Density Grassland | 136.67 |
(Download Full Matrix: Transition Matrix.csv)

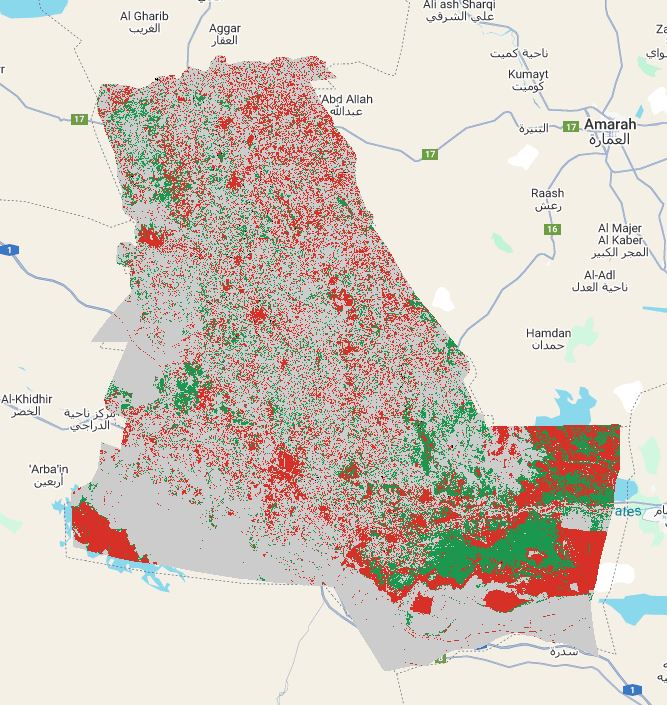
Figure 5. Land cover change map in ThiQar Governorate, 2000–2020 (changed vs. no-change pixels). Full Resolution: Change Map.JPG
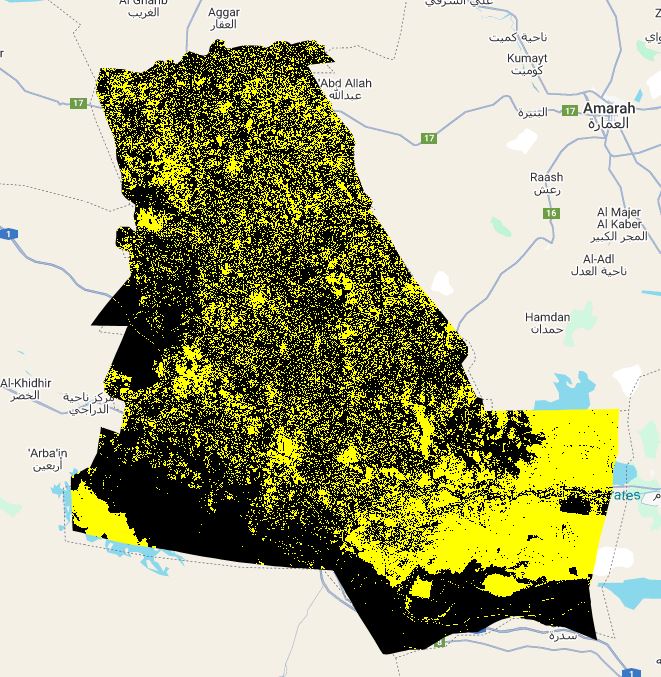
5. Land degradation status based on land-cover change
The land-degradation status layer classifies each pixel as Degraded, Improved, No Change or No Data based solely on land-cover transitions and their interpretation in the UNCCD SDG 15.3.1 framework.
- No Change: 8,411.86 km² (63.28%).
- Degraded: 2,993.15 km² (22.52%).
- Improved: 1,881.86 km² (14.16%).
- No Data: 6.75 km² (0.05%).
Spatial interpretation
Degraded areas are concentrated where wetlands contracted, vegetation was simplified, or land was converted to cropland or built-up. Improved areas correspond to vegetation recovery and density gain, desert greening, ecological restoration, and water gain, forming a mosaic across lowland landscapes.
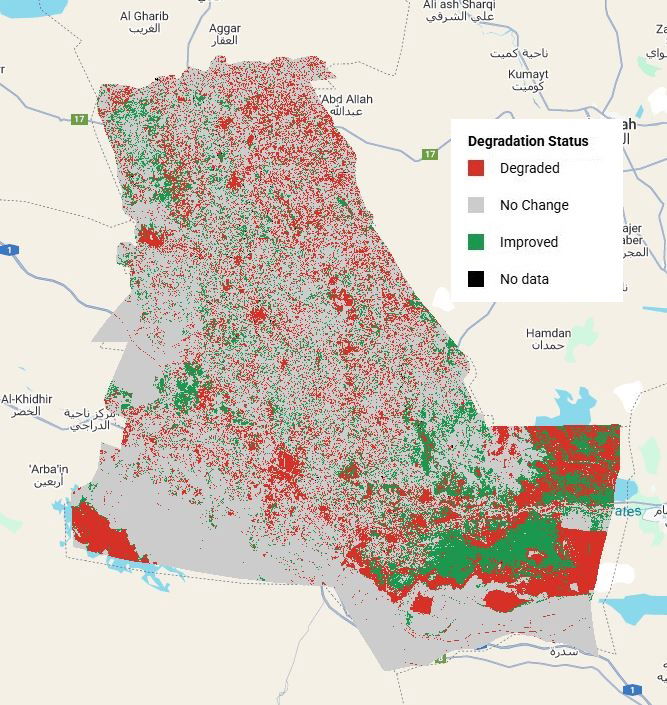
Figure 6. Land degradation status map in ThiQar Governorate, 2000–2020. Full Resolution: Land Degradation status map.JPG
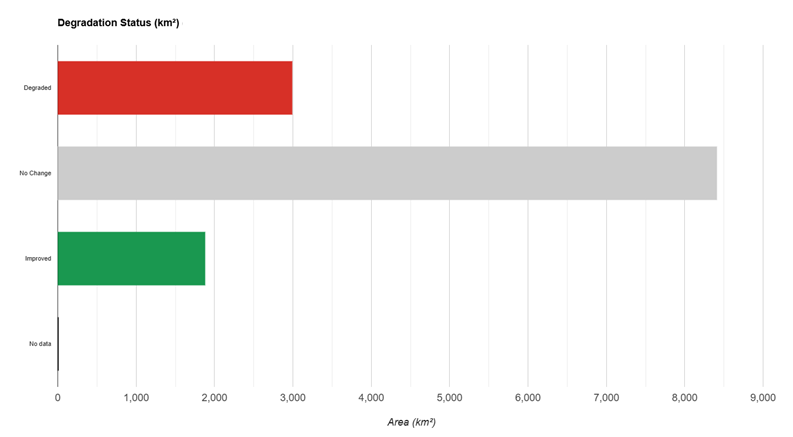
Figure 7. Land degradation status classes by area in ThiQar Governorate, 2000–2020. Full Resolution: Land Degradation Status chart.png
Table 4. Area of land degradation status classes in ThiQar Governorate, 2000–2020.
Class | Area (km²) | Share (%) |
Degraded | 2,993.15 | 22.52 |
No Change | 8,411.86 | 63.28 |
Improved | 1,881.86 | 14.16 |
No data | 6.75 | 0.05 |
(Download: Land Degradation Status map.csv)
6. Types of degradation and improvement
Excluding Stable pixels, the non-stable area in ThiQar totals 4,881.76 km² (36.72% of the governorate).
6.1 Major improvement processes
- Vegetation Density gain: 918.82 km² (18.82% of non-stable; 6.91% of governorate).
- Desert Greening: 507.48 km² (10.40% of non-stable; 3.82% of governorate).
- Ecological restoration: 214.72 km² (4.40% of non-stable; 1.62% of governorate).
- Water gain: 206.66 km² (4.23% of non-stable; 1.55% of governorate).
- Wetland gain: 31.45 km² (0.64% of non-stable; 0.24% of governorate).
- Ecological succession: 2.73 km² (0.06% of non-stable; 0.02% of governorate).
6.2 Major degradation processes
- Wetland Loss: 1,154.01 km² (23.64% of non-stable; 8.68% of governorate).
- Cropland expansion: 1,121.85 km² (22.98% of non-stable; 8.44% of governorate).
- Desertification: 317.18 km² (6.50% of non-stable; 2.39% of governorate).
- Urbanization: 220.65 km² (4.52% of non-stable; 1.66% of governorate).
- Vegetation Density Loss: 179.45 km² (3.68% of non-stable; 1.35% of governorate).
- Vegetation Type Simplification: 0.01 km² (0.00% of non-stable; 0.00% of governorate).
6.3 Wetland dynamics
Wetland loss totals 1,154.01 km², while wetland gain totals 31.45 km². Overall, ThiQar exhibits a net loss of wetlands, alongside substantial open water gain, indicating major wetland system reconfiguration.
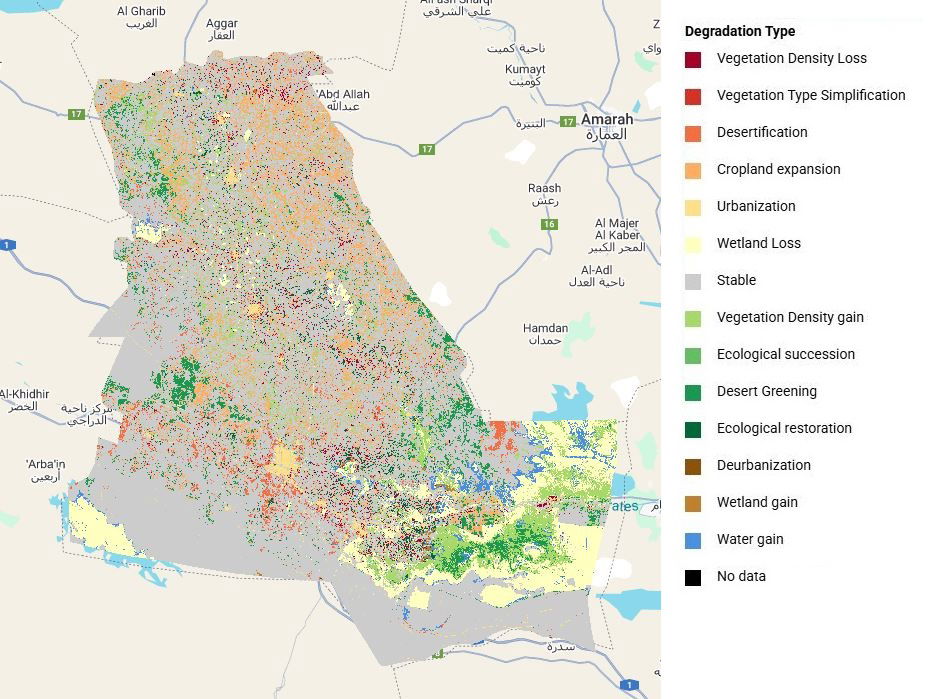
Figure 8. Land degradation and improvement type map in ThiQar Governorate, 2000–2020. Full Resolution: Land Degradation type map.JPG
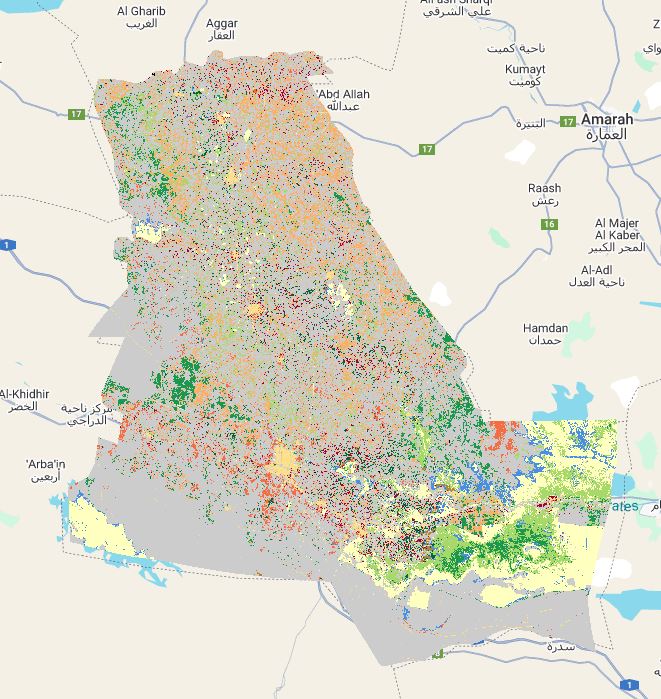

Figure 9. Land degradation and improvement types by area in ThiQar Governorate, 2000–2020. Full Resolution: Land Degradation type chart.png
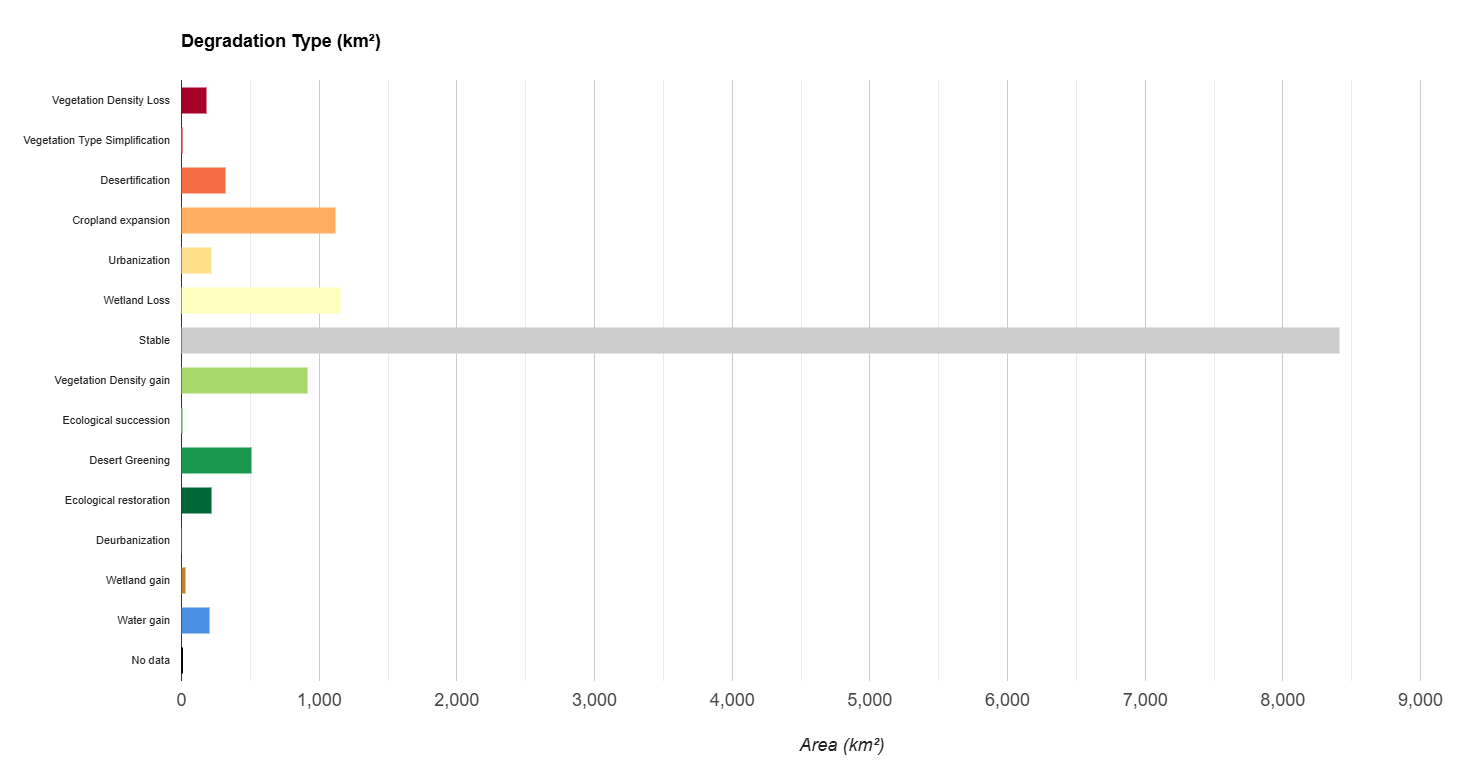
Table 5. Area of land degradation and improvement types in ThiQar Governorate, 2000–2020.
Class | Area (km²) | Share of governorate (%) |
Vegetation Density Loss | 179.45 | 1.35 |
Vegetation Type Simplification | 0.01 | 0.00 |
Desertification | 317.18 | 2.39 |
Cropland expansion | 1,121.85 | 8.44 |
Urbanization | 220.65 | 1.66 |
Wetland Loss | 1,154.01 | 8.68 |
Stable | 8,411.86 | 63.28 |
Vegetation Density gain | 918.82 | 6.91 |
Ecological succession | 2.73 | 0.02 |
Desert Greening | 507.48 | 3.82 |
Ecological restoration | 214.72 | 1.62 |
Wetland gain | 31.45 | 0.24 |
Water gain | 206.66 | 1.55 |
No data | 6.75 | 0.05 |
(Download: Land Degradation type stats.csv)
7. Key messages for ThiQar
- ThiQar is highly dynamic over 2000–2020: about 36.7% of the governorate changed land-cover class.
- Wetland loss is the single largest degradation process, indicating contraction or conversion of wetland ecosystems.
- Cropland expansion is a major driver of change, with extensive conversion from low-density grassland to cropland.
- Open water gain is substantial and many wetland-to-water transitions occur, reflecting strong hydrological dynamics.
- Improvement signals are also prominent: vegetation density gain and desert greening indicate localized recovery or intensification of vegetation cover.
Appendix A. Full land cover transition matrix (2000–2020)
Matrix entries are areas in km². Rows represent 2000 classes and columns represent 2020 classes. Abbreviations are defined below the table.
From\To | DES | LDG | MDG | HDG | SHR | FOR | WSV | WLD | WMD | WHD | WSH | WFO | WAT | SNI | CRP | BUI | NOD |
DES | 3,429.4 | 232.0 | 19.7 | 83.0 | 0.0 | 0.0 | 0.0 | 0.0 | 0.0 | 0.0 | 0.0 | 0.0 | 76.9 | 0.0 | 172.8 | 57.5 | 0.0 |
LDG | 288.4 | 3,230.1 | 432.4 | 87.9 | 0.0 | 0.0 | 0.0 | 0.0 | 0.0 | 0.0 | 0.0 | 0.0 | 101.1 | 0.0 | 877.2 | 104.6 | 0.0 |
MDG | 3.5 | 153.6 | 498.0 | 52.7 | 0.0 | 0.0 | 0.0 | 0.0 | 0.0 | 0.0 | 0.0 | 0.0 | 3.1 | 0.0 | 226.5 | 41.7 | 0.0 |
HDG | 0.2 | 1.2 | 7.8 | 44.1 | 0.3 | 0.2 | 0.0 | 0.0 | 0.0 | 0.0 | 0.0 | 0.0 | 0.5 | 0.0 | 15.9 | 5.5 | 0.0 |
SHR | 0.0 | 0.0 | 0.0 | 0.0 | 0.1 | 0.2 | 0.0 | 0.0 | 0.0 | 0.0 | 0.0 | 0.0 | 0.0 | 0.0 | 0.0 | 0.0 | 0.0 |
FOR | 0.0 | 0.0 | 0.0 | 0.0 | 0.0 | 0.3 | 0.0 | 0.0 | 0.0 | 0.0 | 0.0 | 0.0 | 0.0 | 0.0 | 0.0 | 0.0 | 0.0 |
WSV | 0.0 | 0.0 | 0.0 | 0.0 | 0.0 | 0.0 | 69.5 | 9.1 | 25.6 | 75.7 | 0.0 | 0.0 | 645.4 | 0.0 | 0.5 | 3.3 | 0.0 |
WLD | 0.0 | 0.0 | 0.0 | 0.0 | 0.0 | 0.0 | 5.9 | 53.7 | 107.4 | 113.8 | 0.0 | 0.0 | 450.9 | 0.0 | 4.1 | 3.1 | 0.0 |
WMD | 0.0 | 0.0 | 0.0 | 0.0 | 0.0 | 0.0 | 0.8 | 5.3 | 39.0 | 14.2 | 0.0 | 0.0 | 45.9 | 0.0 | 1.4 | 1.1 | 0.0 |
WHD | 0.0 | 0.0 | 0.0 | 0.0 | 0.0 | 0.0 | 0.1 | 0.5 | 4.2 | 5.6 | 0.0 | 0.0 | 4.2 | 0.0 | 0.2 | 0.1 | 0.0 |
WSH | 0.0 | 0.0 | 0.0 | 0.0 | 0.0 | 0.0 | 0.0 | 0.0 | 0.0 | 0.0 | 0.0 | 0.0 | 0.0 | 0.0 | 0.0 | 0.0 | 0.0 |
WFO | 0.0 | 0.0 | 0.0 | 0.0 | 0.0 | 0.0 | 0.0 | 0.0 | 0.0 | 0.0 | 0.0 | 0.0 | 0.0 | 0.0 | 0.0 | 0.0 | 0.0 |
WAT | 1.9 | 1.5 | 0.8 | 0.3 | 0.0 | 0.0 | 2.8 | 2.1 | 2.9 | 1.1 | 0.0 | 0.0 | 119.3 | 0.0 | 2.2 | 3.8 | 0.0 |
SNI | 0.0 | 0.0 | 0.0 | 0.0 | 0.0 | 0.0 | 0.0 | 0.0 | 0.0 | 0.0 | 0.0 | 0.0 | 0.0 | 0.0 | 0.0 | 0.0 | 0.0 |
CRP | 23.2 | 136.7 | 64.5 | 13.4 | 0.0 | 0.1 | 0.6 | 2.9 | 14.0 | 5.1 | 0.0 | 0.0 | 25.0 | 0.0 | 830.1 | 7.6 | 0.0 |
BUI | 0.0 | 0.0 | 0.0 | 0.0 | 0.0 | 0.0 | 0.0 | 0.0 | 0.0 | 0.0 | 0.0 | 0.0 | 0.0 | 0.0 | 0.0 | 92.6 | 0.0 |
NOD | 0.0 | 0.0 | 0.0 | 0.0 | 0.0 | 0.0 | 0.0 | 0.0 | 0.0 | 0.0 | 0.0 | 0.0 | 0.0 | 0.0 | 0.0 | 0.0 | 0.0 |
Abbreviations: DES=Desert, LDG=Low-Density Grassland, MDG=Medium-Density Grassland, HDG=High-Density Grassland, SHR=Shrubland, FOR=Forest, WSV=Wetland with sparse vegetation, WLD=Wetland with Low-Density Grass, WMD=Wetland with Medium-Density Grass, WHD=Wetland with High-Density Grass, WSH=Wetland with Shrubs, WFO=Wetland with Forest, WAT=Water, SNI=Snow/Ice, CRP=Cropland, BUI=Built-up, NOD=No data