Anbar
1. Introduction
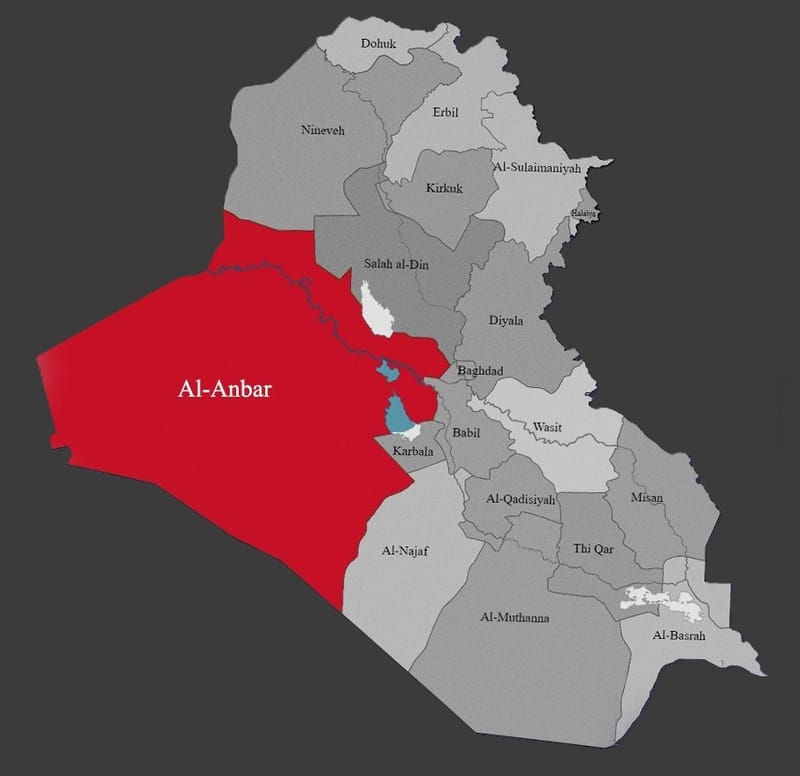
Anbar is Iraq’s largest governorate, with a total area of about 123,700 km². The governorate is dominated by arid and semi-arid environments, with cultivated land and permanent water bodies concentrated along the Euphrates River and around major reservoirs and oases.
This profile summarizes land-cover conditions in 2000 and 2020, quantifies land-cover transitions over the 20-year period, and interprets land degradation status and types according to the UNCCD SDG 15.3.1 methodology. All statistics are derived from the GLCLU v2 (90 m) land-cover dataset, aggregated over the Anbar administrative boundary using the dedicated Iraq Land Degradation Mapping Tool.
2. Land cover status in 2000
2.1 Overall composition
In 2000, Anbar was overwhelmingly dominated by desert land cover, with only narrow belts of vegetation, cropland and water bodies along the Euphrates corridor and in localized depressions and reservoirs.
Key figures for 2000:
- Desert: ~119,000 km² (≈ 96% of the governorate area).
This class covers almost the entire western and southern parts of Anbar, representing bare soil, rocky surfaces and very sparse vegetation typical of arid steppe and desert environments.
- Low-density grassland: ~2,100 km² (≈ 1.7%).
These areas occur mainly in the northern and north-eastern fringe of the governorate and on some desert steppe plateaus, where rainfall and soil conditions allow a discontinuous herbaceous cover.
- Medium- and high-density grassland: together less than 0.5% of the area.
These are limited patches of better-conditioned rangelands, often associated with local topography or higher soil moisture.
- Cropland: ~1,000 km² (≈ 0.8%).
Cropland is concentrated along the Euphrates Valley, around Ramadi, Falluja and other irrigated schemes and oases.
- Built-up areas: ~500 km² (≈ 0.4%).
Built-up land includes the main urban centers (Ramadi, Falluja, Haditha, Al-Qaim, Rutba) and smaller settlements scattered along the main roads and river corridor.
- Water bodies: ~2,000 km² (≈ 1.6%).
This includes the Euphrates River, its associated reservoirs (e.g. Haditha Dam Lake) and several lakes and marshy depressions.
- Forests, shrublands and wetlands: each occupy only very small fractions of the governorate (< 0.2% individually), usually concentrated along the river banks, in wadis and around standing water bodies.
2.2 Spatial pattern
The 2000 land-cover map for Anbar shows:
- A continuous desert matrixacross most of the governorate, fragmented only by:
- the Euphrates green corridor running from the Syrian border southeastwards towards the boundary with Karbala and Baghdad;
- the Haditha reservoir, smaller lakes and wetlands;
- urban centers and irrigated agriculture in localized oases.
- Vegetated land and cropland are therefore highly concentrated in a narrow band, making them particularly sensitive to climatic and anthropogenic pressures.

Figure 1. Land cover map of Anbar Governorate in 2000 (GLCLU v2). (Full Resolution: LC 2000 map.JPG)
Shows the spatial distribution of the 17 national land cover classes, highlighting the dominance of desert and sparsely vegetated rangelands, with cropland, wetlands and water bodies confined mainly to the Euphrates corridor and local oases.

Figure 2. Land cover composition of Anbar Governorate in 2000. (Full Resolution: LC 2020 map.JPG )
Bar chart showing total area (km²) for each land cover class in 2000, derived from GLCLU v2; desert occupies most of the governorate, followed by low-density grassland and small shares of cropland, wetlands and water.
Table 1. Area of land cover classes in Anbar Governorate in 2000.
Tabulated statistics of land cover area (km² and percentage of governorate area) for all 17 classes, based on the 2000 GLCLU product.
Class | Area (km²) |
Desert | 117,633.40 |
Low-Density Grassland | 2,078.35 |
Medium-Density Grassland | 269.194 |
High-Density Grassland | 88.077 |
Shrubland | 0.949 |
Forest | 0.109 |
Wetland with sparse vegetation | 131.8 |
Wetland with Low-Density Grass | 26.848 |
Wetland with Medium-Density Grass | 3.61 |
Wetland with High-Density Grass | 0.782 |
Wetland with Shrubs | 0.007 |
Wetland with Forest | 0.007 |
Water | 2,007.72 |
Snow/Ice | 0 |
Cropland | 984.669 |
Built-up | 502.356 |
No data | 0 |
(Download: LC 2000 stats.csv )
3. Land cover status in 2020
3.1 Overall composition
By 2020, the broad structure of land cover in Anbar remained dominated by desert, but several important shifts are evident in the statistics.
Key figures for 2020:
- Desert: ~116,800 km² (≈ 94.5% of the governorate).
Desert remains the dominant class, but its area decreased by roughly 2,200 km² compared with 2000.
- Low-density grassland: ~2,800 km² (≈ 2.3%).
This represents a notable increase (≈ 700 km²), suggesting expansion of sparse herbaceous cover on the desert margins and steppe areas.
- Cropland: ~1,100 km² (≈ 0.9%).
Cropland area increased by about 120 km² (~12% growth), largely associated with the Euphrates corridor and new or intensified irrigated schemes.
- Built-up areas: ~800 km² (≈ 0.6%).
Built-up land expanded by approximately 280 km² (~57% increase), reflecting urban growth around major towns and the expansion of infrastructure corridors.
- Water bodies: ~1,840 km² (≈ 1.5%).
Water surfaces declined by roughly 170 km² (~8% decrease), indicating partial shrinkage of reservoirs and water bodies.
- Other classes (grassland of higher density, shrubland, forest, wetlands) remain small in absolute terms, with modest increases or stable extent in specific locations.
3.2 Spatial pattern
The 2020 land-cover map indicates:
- A slight contraction of the pure desert class, mainly along the fringes of the Euphrates corridor and some steppe areas, where desert pixels changed to low-density grassland, cropland or water.
- Expansion of irrigated cropland and urban land around existing population centers and irrigation schemes.
- Localized reductions in open water, especially along reservoir shorelines and in some wetland depressions.
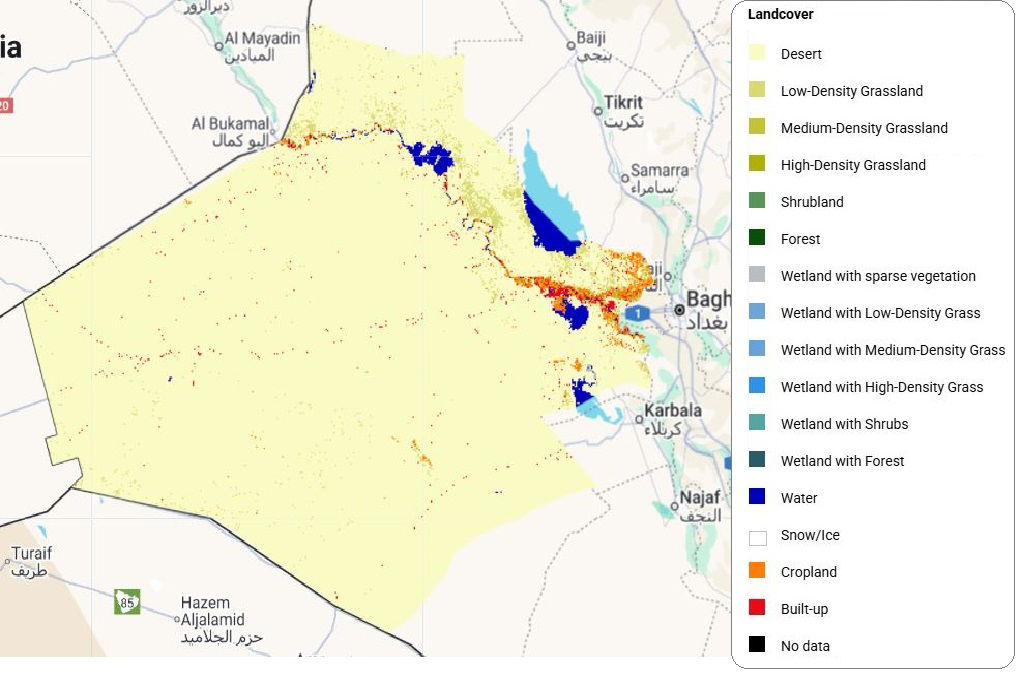
Figure 3.Land cover map of Anbar Governorate in 2020 (GLCLU v2). (Full Resolution: LC 2020 map.JPG)
Updated distribution of the 17 land cover classes, illustrating changes along the Euphrates valley and in isolated agricultural and wetland systems while the desert matrix remains largely unchanged.

Figure 4. Land cover composition of Anbar Governorate in 2020. (Full Resolution: LC 2020 map.png)
Bar chart of total area (km²) by land cover class for 2020, highlighting increases in cropland and built-up areas and the relative stability of extensive desert and rangeland zones.
Table 2. Area of land cover classes in Anbar Governorate in 2020.
Summary table reporting area (km² and percentage) of each land cover class in 2020 from the GLCLU v2 dataset.
Class | Area (km²) |
Desert | 116,863.32 |
Low-Density Grassland | 2,806.65 |
Medium-Density Grassland | 214.515 |
High-Density Grassland | 29.962 |
Shrubland | 0.936 |
Forest | 0.611 |
Wetland with sparse vegetation | 72.712 |
Wetland with Low-Density Grass | 4.216 |
Wetland with Medium-Density Grass | 1.813 |
Wetland with High-Density Grass | 0.905 |
Wetland with Shrubs | 0.013 |
Wetland with Forest | 0 |
Water | 1,839.61 |
Snow/Ice | 0 |
Cropland | 1,104.27 |
Built-up | 788.346 |
No data | 0 |
(Download: LC 2020 stats.csv )
4. Land-cover change (2000–2020)
4.1 Overall magnitude of change
The land-cover change analysis between 2000 and 2020 shows that:
- Approximately 2,882 km² of Anbar (about 2.3% of the governorate area) experienced a change in land-cover class.
- Conversely, about 97.7% of the governorate remained stable in terms of land cover over the 20-year period.
The change map highlights that most changes are concentrated:
- Along the Euphrates River valley, especially downstream of Haditha and in the vicinity of Ramadi and Falluja.
- Around reservoirs and lakes, where water fluctuations and shoreline dynamics lead to repeated transitions between water, wetland, cropland and desert.
- In and around major urban centers and infrastructure corridors, where built-up expansion replaces cropland or desert.
4.2 Dominant transitions
The transition matrix for Anbar shows several key land-cover transitions (area figures rounded):
- Desert → Low-density grassland: ~882 km²
- This is the single largest transition, indicating widespread desert greening or vegetation density gain on previously bare or very sparsely vegetated areas.
- Water → Desert: ~387 km²
- Represents the contraction of surface water, likely due to reservoir drawdown, reduced inflows or sedimentation and the exposure of former lakebeds and river margins.
- Desert → Cropland: ~183 km²
- Reflects cropland expansion into marginal desert areas, typically under irrigation along the Euphrates and in oases.
- Desert → Water: ~172 km²
- Indicates the flooding or impoundment of desert areas, for example due to reservoir filling or expansion of irrigation canals and ponds.
- Desert → Built-up: ~156 km²
- Captures urbanization, with new towns, suburbs, industrial zones and infrastructure replacing desert land.
- Low-density grassland → Desert: ~140 km²
- Suggests episodes of vegetation loss and re-desertification in some rangeland areas.
- Low-density grassland → Cropland: ~110 km²
- Indicates conversion of grazing lands into irrigated agriculture.
These transitions show that desert areas function as both a source and a sink of change: they lose area to grassland, cropland, water and built-up land, but also gain area at the expense of grassland and water bodies. The net effect is a slight reduction of pure desert and a modest expansion of vegetated and urban land, but also significant water losses.
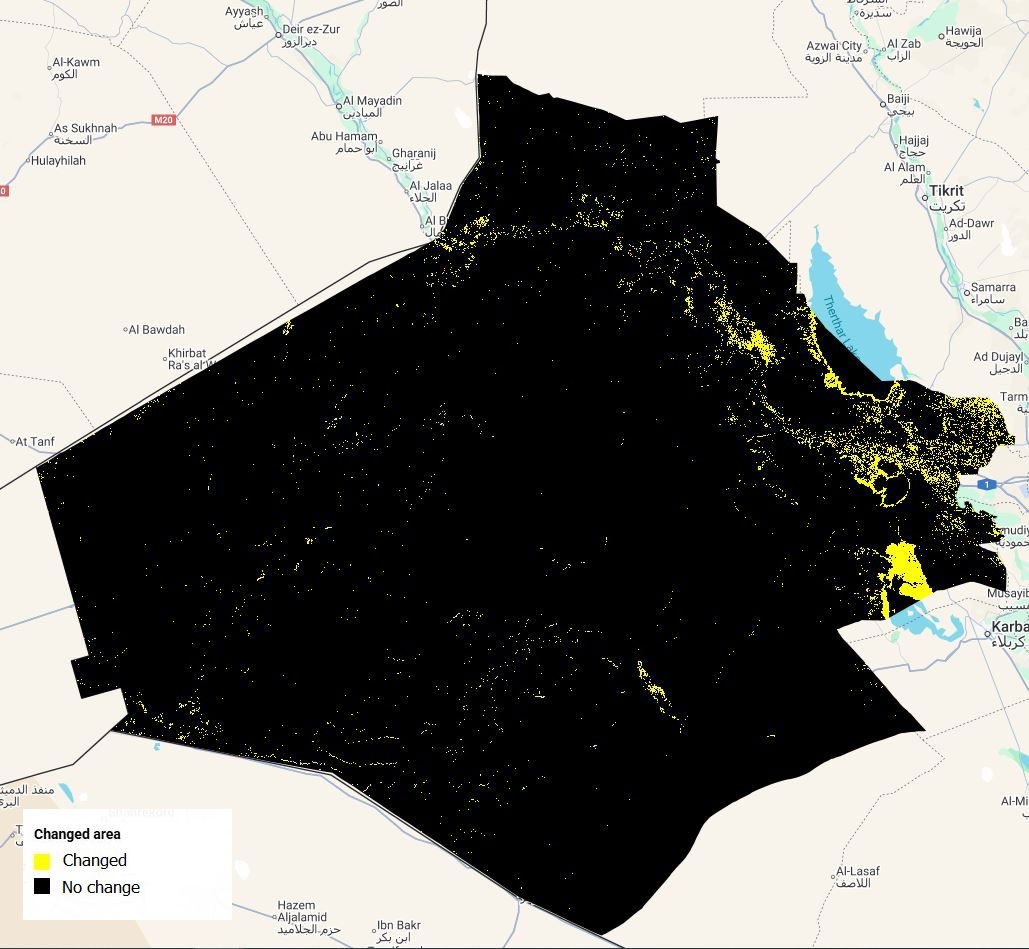
Figure 5. Land cover change map in Anbar Governorate, 2000–2020. (Full Resolution: Change Map.JPG )
Binary map of “changed” versus “no-change” pixels between 2000 and 2020, highlighting localized transformation zones along the Euphrates river, irrigated schemes and urban centres within an otherwise stable desert landscape.
Table 3. Land cover transition matrix in Anbar Governorate, 2000–2020 (17 × 17 classes).
Confusion-style matrix showing areal transitions (km²) from each 2000 land cover class (rows) to each 2020 class (columns); the diagonal represents stable land cover, while off-diagonal entries quantify specific conversions such as desert to cropland, cropland to built-up, and water to wetlands or cropland.

(Download: Change_Matrix.csv)
5. Land degradation status based on land-cover change
The land-degradation status layer classifies each pixel as Degraded, Improved, No Change or No Data based solely on land-cover transitions and their interpretation in the UNCCD framework.
For Anbar (2000–2020):
- No Change: ~121,000 km² (≈ 97.7%of the governorate).
- The vast majority of Anbar shows no land-cover-based evidence of degradation or improvement over the 20-year period.
- Degraded: ~1,330 km² (≈ 1.1%of the governorate).
- These areas exhibit transitions interpreted as loss of vegetation, simplification of ecosystems, desertification, wetland loss, cropland expansion in natural ecosystems, or urbanization.
- Improved: ~1,540 km² (≈ 1.2%of the governorate).
- These pixels correspond to vegetation recovery, desert greening, ecological restoration, wetland or water gain, or deurbanization.
- No data: a very small area (< 0.1%) where consistent land-cover observations are not available across the time series.
Spatial interpretation
- Degraded areas(red on the map) are mainly located:
- Along parts of the Euphrates corridor, where water and wetland contraction, vegetation loss, cropland expansion and urbanization have occurred.
- Around specific reservoirs and irrigated schemes, where natural vegetation was converted to cropland or exposed as bare ground due to water decline.
- Improved areas(green on the map) are concentrated:
- In zones experiencing desert greening, where desert pixels shifted to low-density grassland or higher vegetation density.
- In locations of ecological restoration or water gain, such as sections of the river and certain reservoirs where water or vegetated cover increased over 2000–2020.
Overall, Anbar exhibits a balanced picture in terms of land-cover-based degradation: slightly more area is mapped as improved than degraded, but both categories remain relatively small compared with the vast extent of stable desert.
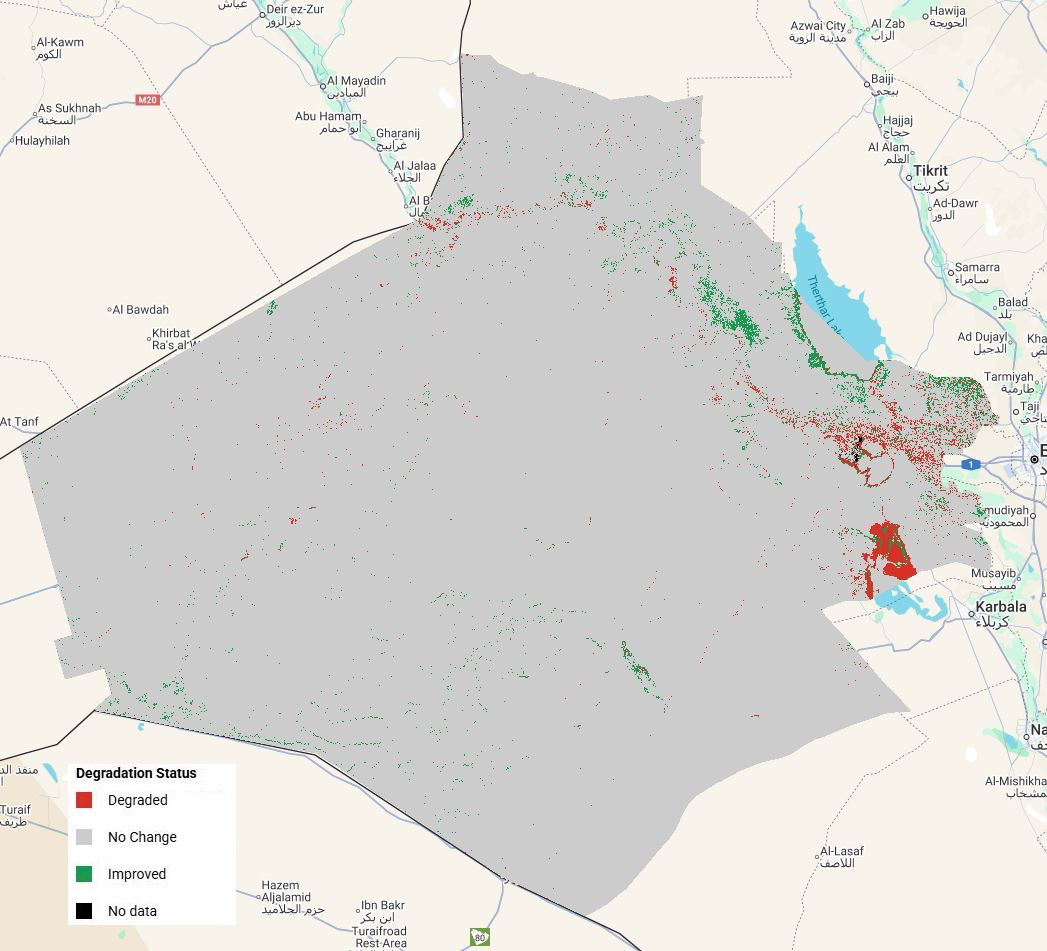
Figure 6. Land degradation status map in Anbar Governorate, 2000–2020. (Full Resolution: Land degradation status map.JPG)
UNCCD SDG 15.3.1–compliant classification of each pixel as degraded, improved, or stable (no change) based on land cover transitions only, with “no data” shown where input information is unavailable.

Figure 7. Land degradation status classes by area in Anbar Governorate, 2000–2020. (Full Resolution: Land degradation status chart.png )
Bar chart showing total degraded, stable and improved area (km²) for the period 2000–2020, illustrating the predominance of stable land with comparatively smaller but non-negligible patches of degradation and improvement.
Table 4. Area of land degradation status classes in Anbar Governorate, 2000–2020.
Statistical summary of degraded, stable, improved and no-data areas (km² and percentage of the governorate), derived from land-cover-based SDG 15.3.1 status assessment.
Class | area_km2 |
Degraded | 1339.0 |
No Change | 120845.5 |
Improved | 1524.1 |
No data | 19.3 |
(Download: Land degradation type stats.csv)
6. Types of degradation and improvement
The degradation type layer further disaggregates non-stable pixels into specific processes. Excluding areas classified as “Stable”, the total non-stable area in Anbar amounts to about 2,882 km² (≈ 2.3% of the governorate). Within this non-stable domain, the main types are:
6.1 Major improvement processes
- Desert Greening: ~1,073 km²
- This is the dominant process, representing about 37% of all non-stable area and 0.9% of the total governorate area.
- It corresponds to transitions from desert to grasslands or other vegetated classes, indicating increased vegetation cover, possibly linked to favorable climatic conditions, localized restoration efforts or changes in land management.
- Water Gain: ~211 km²
- About 7% of non-stable area (≈ 0.17% of Anbar).
- These are pixels where non-wetland classes converted to open water, such as reservoir filling, creation of irrigation ponds or expansion of river channels.
- Ecological Restoration: ~135 km²
- Approximately 5% of non-stable area.
- This category captures transitions from cropland or other modified classes back to natural vegetation, or marked increases in vegetation density.
- Vegetation Density Gain & Ecological Succession: together ~58 km²
- These represent localized improvements in rangelands and natural vegetation structure.
6.2 Major degradation processes
- Desertification: ~631 km²
- About 22% of non-stable area and 0.5% of the total governorate.
- It reflects transitions from vegetated or wet classes to desert, particularly grassland or cropland pixels losing vegetation cover and becoming bare.
- Urbanization: ~285 km² (≈ 10% of non-stable area).
- This corresponds to conversion of natural or agricultural land to built-up, mainly around Ramadi, Falluja and other towns.
- Cropland Expansion into Natural Ecosystems: ~192 km² (≈ 7% of non-stable area).
- Indicates encroachment of agriculture into rangelands, wetlands or other natural vegetation, particularly along the Euphrates corridor.
- Wetland Loss: ~112 km² (≈ 4% of non-stable area).
- Represents conversion of wetlands to terrestrial classes (desert, cropland or natural vegetation), typically due to hydrological changes, drainage or reduced inflows.
- Vegetation Density Loss: ~119 km² (≈ 4% of non-stable area).
- Captures declines in vegetation cover within grasslands and other vegetated classes, potentially linked to drought, overgrazing or land-use pressure.
- Vegetation Type Simplification: very small area (~0.05 km²), but it indicates localized shifts from more complex to simpler vegetation communities.
6.3 Wetland dynamics
- Wetland Gain: ~48 km² versus Wetland Loss of ~112 km².
- Overall, Anbar displays a net loss of wetland area, consistent with observed water contraction in some reservoirs and marshy depressions, although localized wetland gain is recorded where new or expanded water bodies occur.

Figure 8. Land degradation and improvement type map in Anbar Governorate, 2000–2020. (Full Resolution: Land degradation type map.JPG)
Spatial distribution of detailed degradation and improvement processes (e.g. vegetation density loss, desertification, cropland expansion, urbanization, wetland loss, vegetation density gain, desert greening, ecological restoration and water gain) inferred from land cover transitions.

Figure 9. Land degradation and improvement types by area in Anbar Governorate, 2000–2020. (Full Resolution: Land degradation type chart.png)
Bar chart showing the area (km²) of each degradation/improvement type, distinguishing pressure-driven changes (e.g. cropland expansion, urbanization) from positive trends (e.g. desert greening, ecological restoration, water and wetland gains).
Table 5. Area of land degradation and improvement types in Anbar Governorate, 2000–2020.
Tabulated areas (km² and percentage) for all degradation and improvement types used in the UNCCD land-cover change framework, supporting interpretation of dominant processes shaping land dynamics in Anbar.
Class | area_km2 |
Vegetation Density Loss | 119.2 |
Vegetation Type Simplification | 0.1 |
Desertification | 630.9 |
Cropland expansion | 191.8 |
Urbanization | 284.8 |
Wetland Loss | 112.2 |
Stable | 120845.5 |
Vegetation Density gain | 36 |
Ecological succession | 21.8 |
Desert Greening | 1072.8 |
Ecological restoration | 134.5 |
Wetland gain | 48.1 |
Water gain | 210.8 |
No data | 19.3 |
(Download: Land degradation type stats.csv)
7. Key messages for Anbar
- Desert dominates and remains largely stable.
Around 95% of Anbar is desert, and almost 98% of the governorate shows no land-cover-based degradation or improvement between 2000 and 2020.
- Change is concentrated in a narrow productive corridor.
Most transitions occur along the Euphrates River and associated irrigation schemes and reservoirs, where cropland, urban land and water interact dynamically with desert and grasslands.
- Desert greening is the single largest process.
The largest share of non-stable area corresponds to desert pixels gaining vegetation, showing that parts of the rangeland system experienced improved vegetation cover over the past two decades.
- Degradation hotspots exist and are linked to water and land-use pressure. Desertification, wetland loss, cropland expansion into natural ecosystems and urbanization together account for around 40% of non-stable area, emphasizing the need for sustainable water and land management in key agricultural and wetland zones.
- Water and wetlands are under pressure.
Despite some localized water and wetland gains, the net effect is a reduction in water surfaces and wetland extent, which can exacerbate vulnerability to drought and ecosystem degradation.
- Monitoring at governorate level is essential.
This Anbar profile demonstrates how high-resolution land-cover data and UNCCD-aligned indicators can be used to track land-degradation dynamics and support integrated planning across the water–agriculture–rangeland nexus.