Al Muthanna
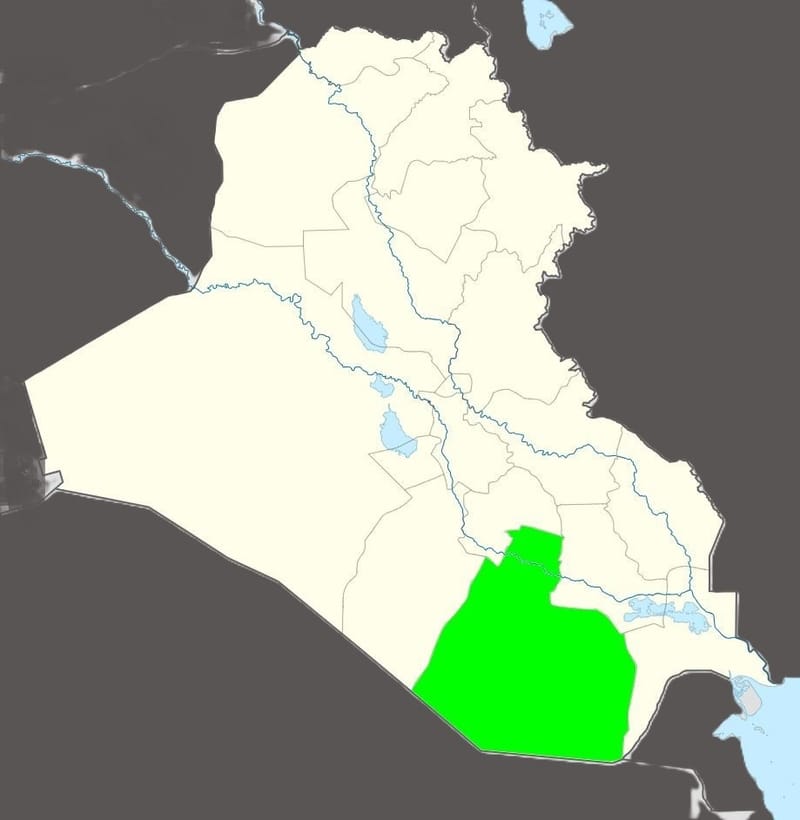
Al Muthanna Governorate Land Cover and Land Degradation Profile (2000–2020)
This report summarizes land-cover conditions in Al Muthanna Governorate for 2000 and 2020, quantifies land-cover transitions over the 20-year period, and interprets land degradation status and types according to the UNCCD SDG 15.3.1 land-cover change framework. Statistics are derived from the GLCLU v2 (90 m) land-cover dataset aggregated to the Al Muthanna administrative boundary.
Total governorate area analyzed: 51,645.67 km².
2. Land cover status in 2000
2.1 Overall composition
- Desert: 49,290.86 km² (95.44%).
- Low-Density Grassland: 1,389.43 km² (2.69%).
- Cropland: 453.35 km² (0.88%).
- Medium-Density Grassland: 259.15 km² (0.50%).
- Built-up: 73.79 km² (0.14%).
- Water: 23.87 km² (0.05%).
- Wetlands (all wetland classes combined): 125.93 km² (0.24%).
2.2 Spatial pattern
Al Muthanna is dominated by arid desert surfaces. Vegetated classes and cropland are limited in extent and are primarily concentrated in the northern part of the governorate and along localized water and irrigation features.

Figure 1. Land cover map of Al Muthanna Governorate in 2000 (GLCLU v2). (Full Resolution: Land cover 2000 map.png )
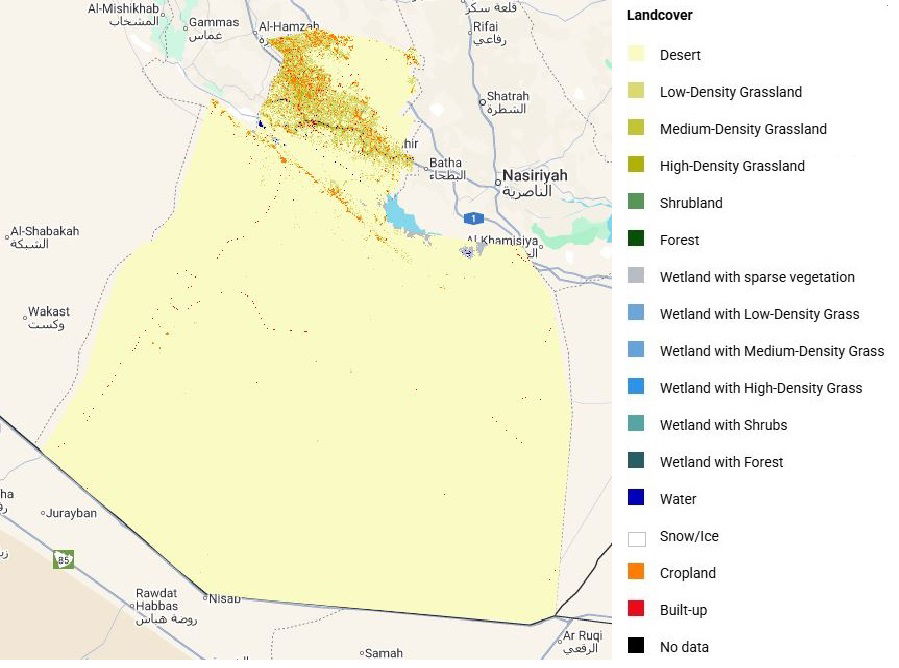

Figure 2. Land cover composition of Al Muthanna Governorate in 2000 (area in km² by class). (Full Resolution: Land cover 2000 chart.png)
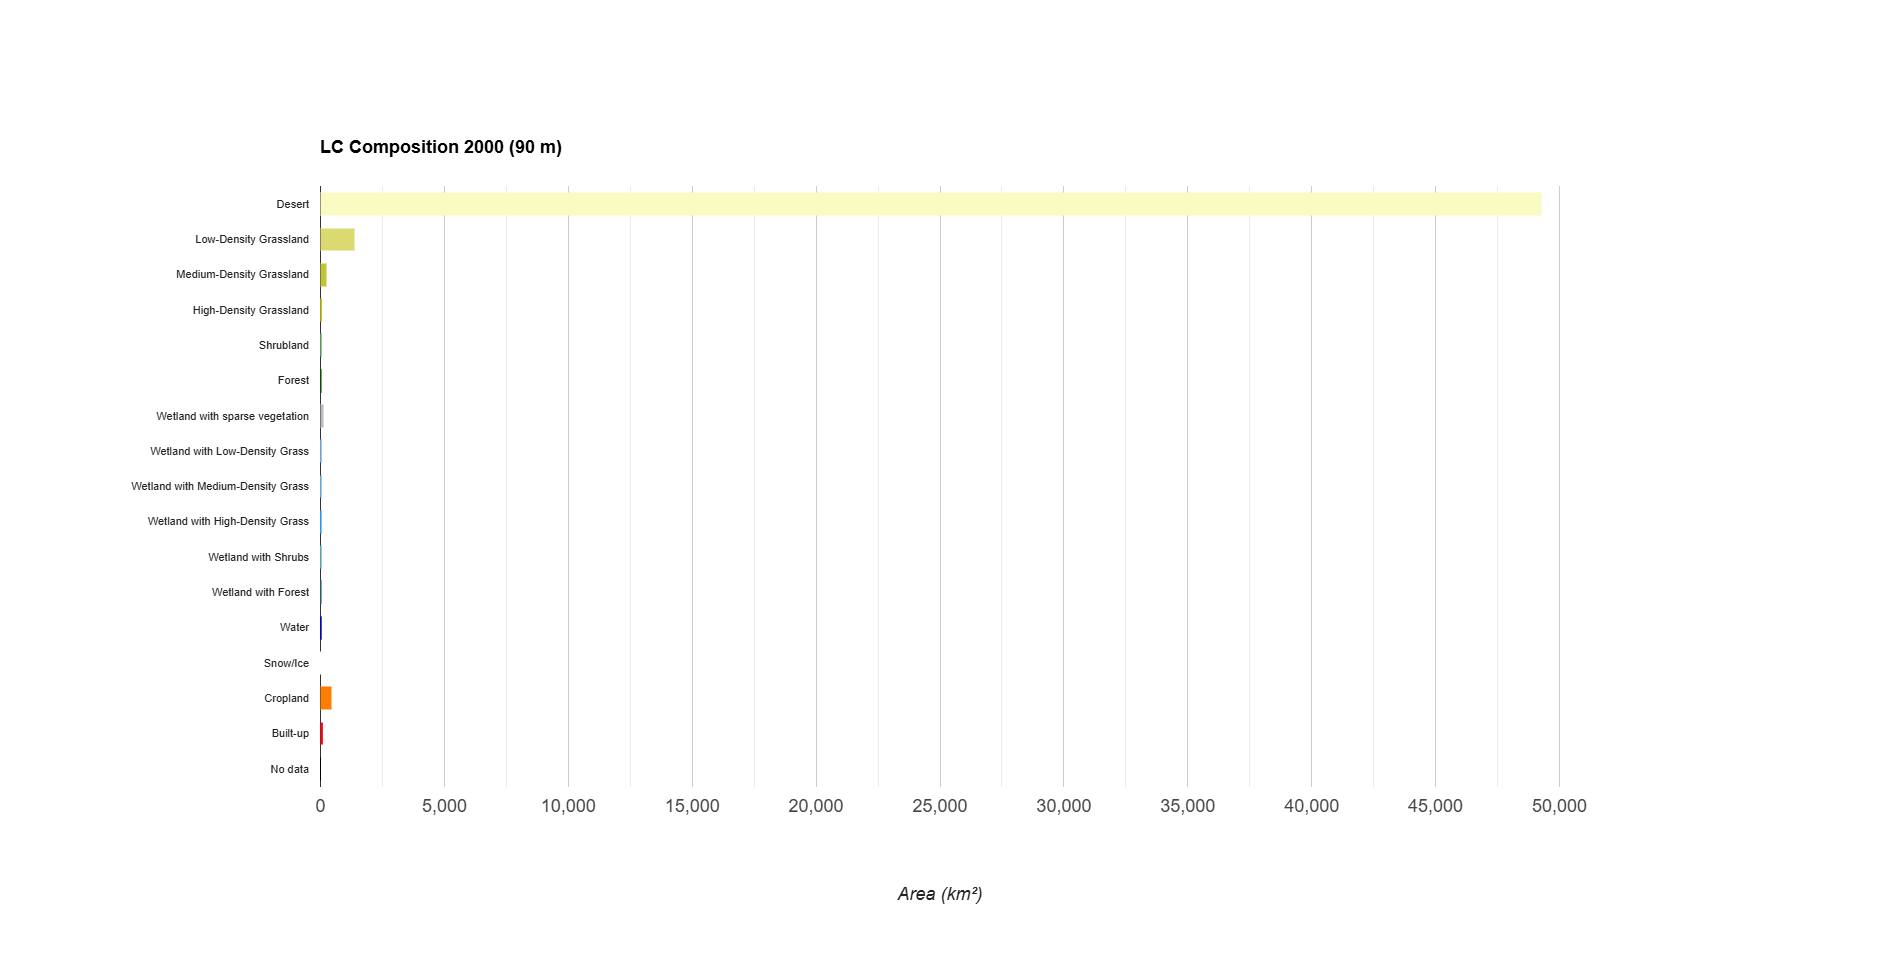
Table 1. Area of land cover classes in Al Muthanna Governorate in 2000.
Class | Area (km²) | Share (%) |
Desert | 49,290.86 | 95.44 |
Low-Density Grassland | 1,389.43 | 2.69 |
Medium-Density Grassland | 259.15 | 0.50 |
High-Density Grassland | 28.81 | 0.06 |
Shrubland | 0.37 | 0.00 |
Forest | 0.10 | 0.00 |
Wetland with sparse vegetation | 115.36 | 0.22 |
Wetland with Low-Density Grass | 7.65 | 0.01 |
Wetland with Medium-Density Grass | 2.25 | 0.00 |
Wetland with High-Density Grass | 0.65 | 0.00 |
Wetland with Shrubs | 0.01 | 0.00 |
Wetland with Forest | 0.01 | 0.00 |
Water | 23.87 | 0.05 |
Snow/Ice | 0.00 | 0.00 |
Cropland | 453.35 | 0.88 |
Built-up | 73.79 | 0.14 |
No data | 0.00 | 0.00 |
(Download: Land cover 2000 stats.csv)
3. Land cover status in 2020
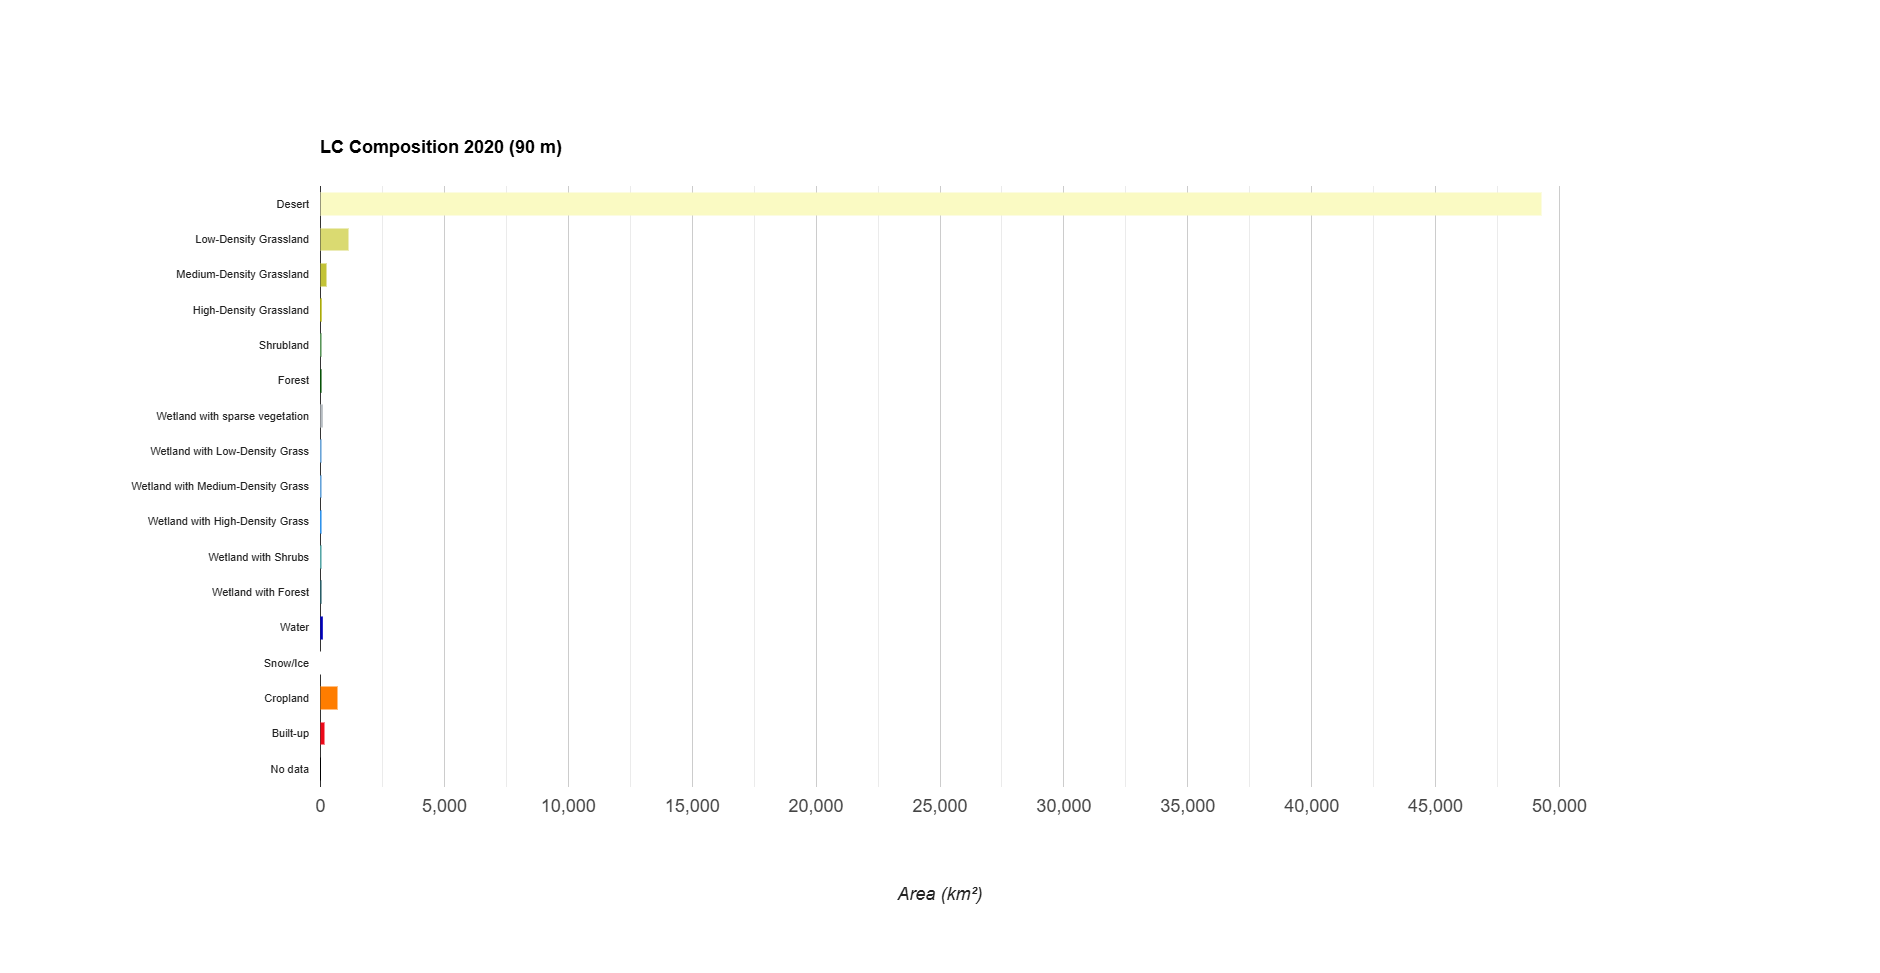
3.1 Overall composition
- Desert: 49,263.63 km² (95.39%).
- Low-Density Grassland: 1,119.13 km² (2.17%).
- Cropland: 700.62 km² (1.36%).
- Medium-Density Grassland: 225.92 km² (0.44%).
- Built-up: 165.25 km² (0.32%).
- Water: 71.24 km² (0.14%).
- Wetlands (all wetland classes combined): 81.87 km² (0.16%).
Between 2000 and 2020, Al Muthanna remains overwhelmingly desert-dominated. Nevertheless, cropland, built-up, and open water increase slightly, while low-density grassland declines.
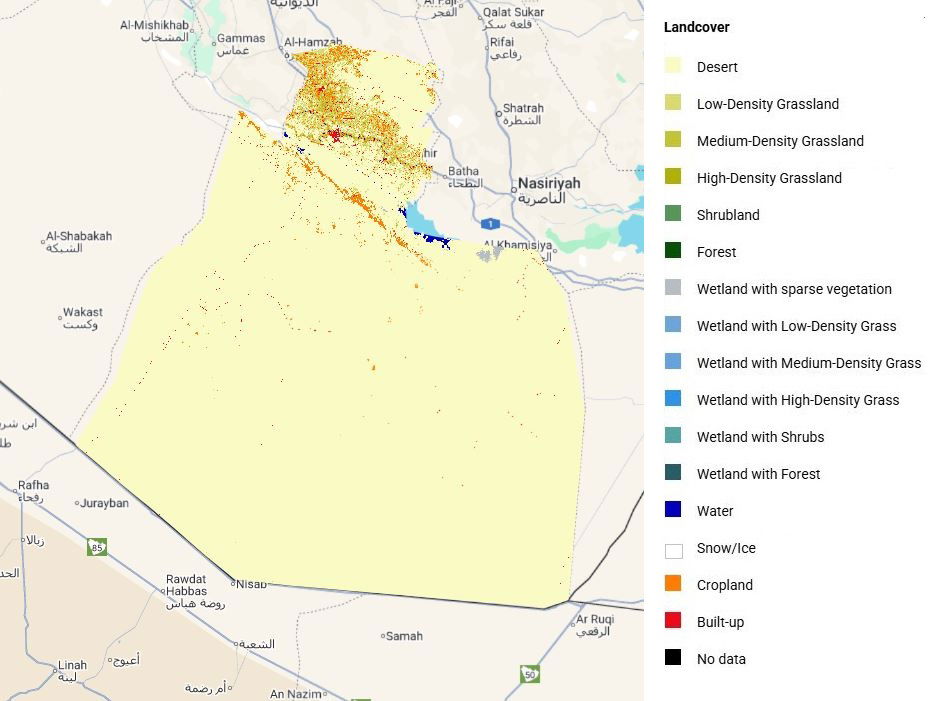
3.2 Spatial pattern
The 2020 map indicates that the limited changes are spatially concentrated in the northern/northeastern part of Al Muthanna. Most of the governorate remains stable desert with sparse, localized land-use and vegetation changes.
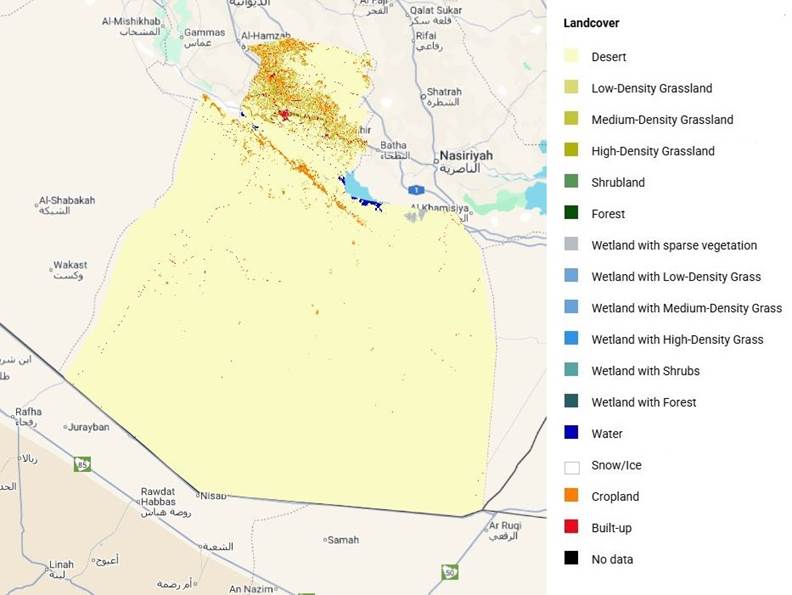
Figure 3. Land cover map of Al Muthanna Governorate in 2020 (GLCLU v2). (Full Resolution: Land cover 2020 map.JPG)

Figure 4. Land cover composition of Al Muthanna Governorate in 2020 (area in km² by class). (Full Resolution: Land cover 2020 chart.png )
Table 2. Area of land cover classes in Al Muthanna Governorate in 2020.
Class | Area (km²) | Share (%) |
Desert | 49,263.63 | 95.39 |
Low-Density Grassland | 1,119.13 | 2.17 |
Medium-Density Grassland | 225.92 | 0.44 |
High-Density Grassland | 17.52 | 0.03 |
Shrubland | 0.20 | 0.00 |
Forest | 0.29 | 0.00 |
Wetland with sparse vegetation | 72.14 | 0.14 |
Wetland with Low-Density Grass | 5.38 | 0.01 |
Wetland with Medium-Density Grass | 3.47 | 0.01 |
Wetland with High-Density Grass | 0.86 | 0.00 |
Wetland with Shrubs | 0.01 | 0.00 |
Wetland with Forest | 0.01 | 0.00 |
Water | 71.24 | 0.14 |
Snow/Ice | 0.00 | 0.00 |
Cropland | 700.62 | 1.36 |
Built-up | 165.25 | 0.32 |
No data | 0.00 | 0.00 |
(Download: Land cover 2020 stats.csv)
4. Land-cover change (2000–2020)
4.1 Overall magnitude of change
Approximately 1,148.02 km² of Al Muthanna (2.22%) changed land-cover class between 2000 and 2020, while 50,497.65 km² (97.78%) remained stable.
4.2 Dominant transitions
The dominant transitions reflect localized land-use adjustments and vegetation dynamics in the north, including grassland-to-cropland conversion, desert–grassland interchange, and small changes in water extent.
Table 3. Major land cover transitions in Al Muthanna Governorate, 2000–2020 (top 10 by area).
From (2000) | To (2020) | Area (km²) |
Low-Density Grassland | Desert | 225.01 |
Low-Density Grassland | Cropland | 188.13 |
Desert | Cropland | 167.22 |
Cropland | Low-Density Grassland | 83.14 |
Desert | Low-Density Grassland | 78.87 |
Medium-Density Grassland | Low-Density Grassland | 65.53 |
Low-Density Grassland | Medium-Density Grassland | 54.76 |
Desert | Built-up | 46.63 |
Wetland with sparse vegetation | Water | 46.47 |
Cropland | Desert | 42.75 |
(Download: Al Muthanna Transition Matrix.csv)
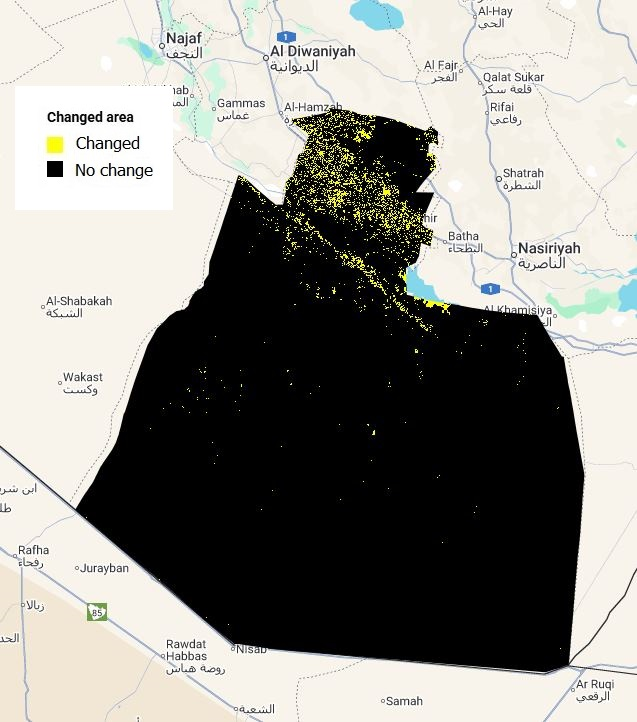
Figure 5. Land cover change map in Al Muthanna Governorate, 2000–2020 (changed vs. no-change pixels). (Full Resolution: Change map.JPG)
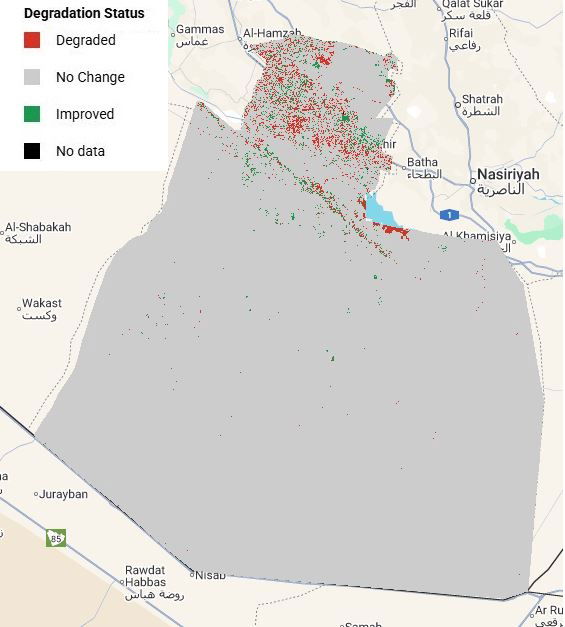
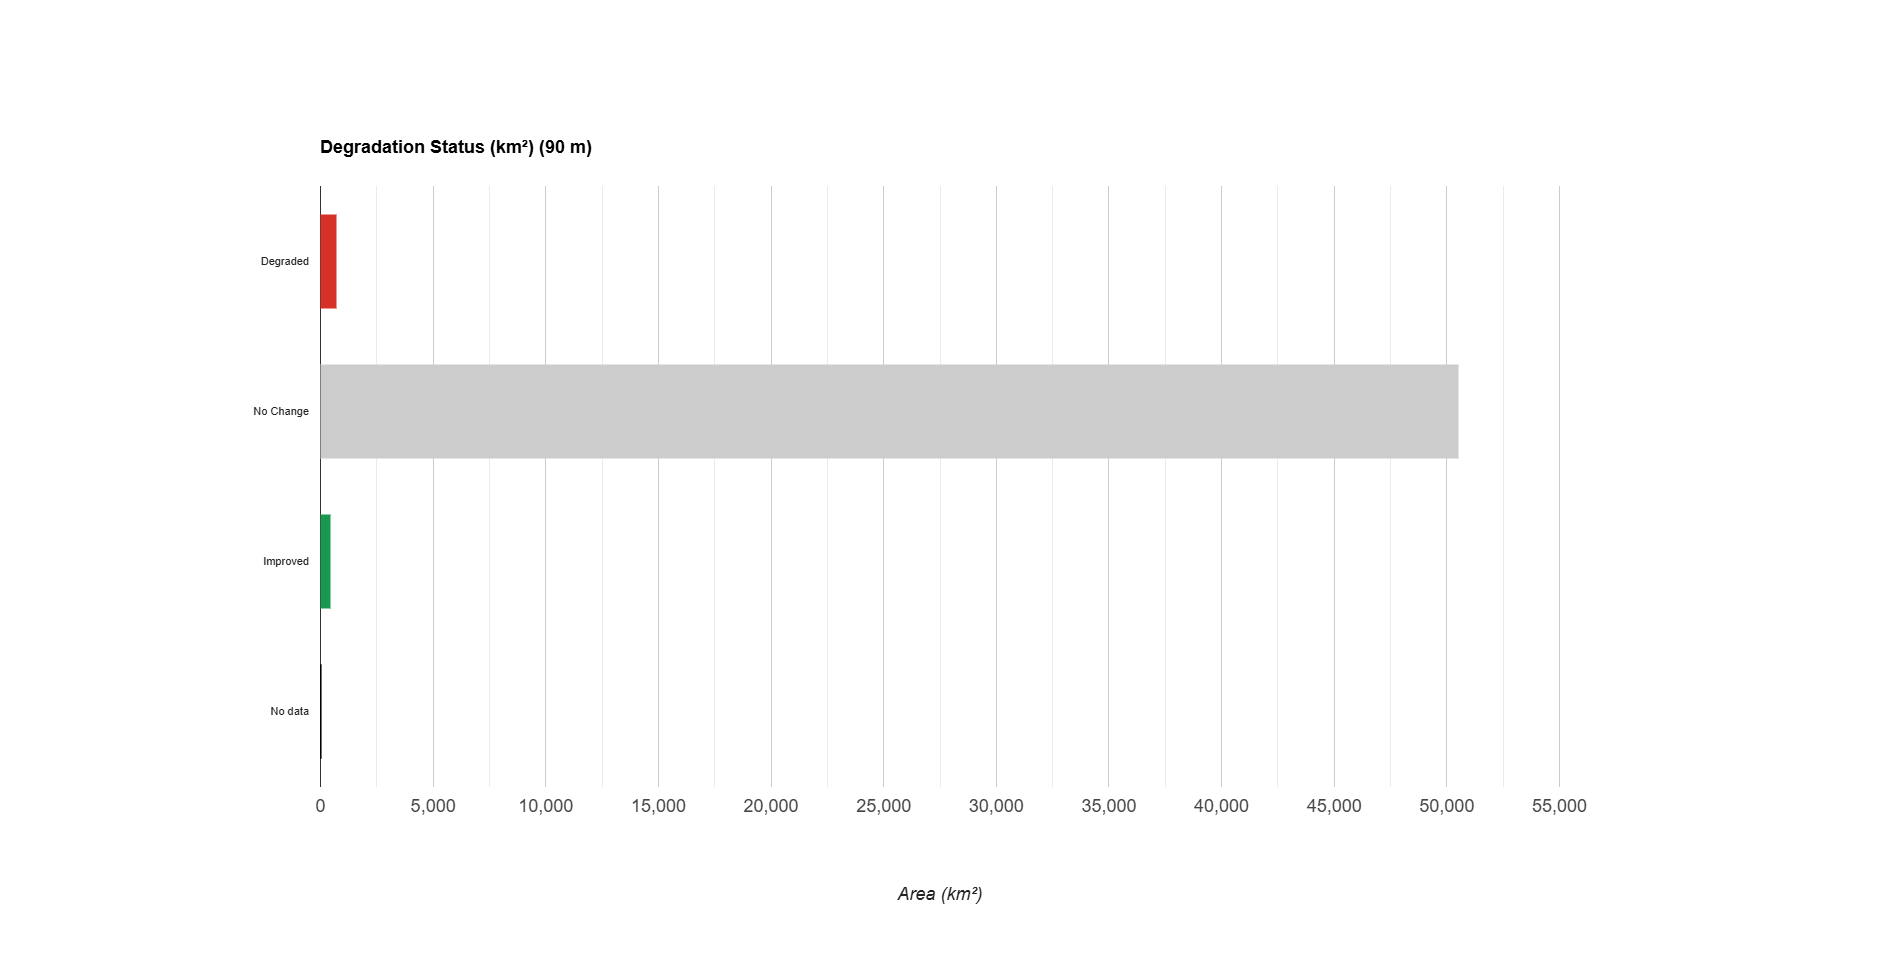
5. Land degradation status based on land-cover change
The land-degradation status layer classifies each pixel as Degraded, Improved, No Change or No Data based solely on land-cover transitions and their interpretation under the UNCCD SDG 15.3.1 framework.
- No Change: 50,497.65 km² (97.78%).
- Degraded: 718.64 km² (1.39%).
- Improved: 428.64 km² (0.83%).
- No data: 0.73 km² (0.00%).
Spatial interpretation
Most of Al Muthanna is classified as No Change, consistent with the stable desert background. Degraded and improved pixels are spatially concentrated in the northern part of the governorate, where land use and vegetation patterns are more dynamic.

Figure 6. Land degradation status map in Al Muthanna Governorate, 2000–2020. (Full Resolution: Land degradation status map.JPG)

Figure 7. Land degradation status classes by area in Al Muthanna Governorate, 2000–2020. (Full Resolution: Land degradation status map chart.png)
Table 4. Area of land degradation status classes in Al Muthanna Governorate, 2000–2020.
Class | Area (km²) | Share (%) |
Degraded | 718.64 | 1.39 |
No Change | 50,497.65 | 97.78 |
Improved | 428.64 | 0.83 |
No data | 0.73 | 0.00 |
(Download: Land degradation status stats.csv)
6. Types of degradation and improvement
Excluding Stable pixels, the non-stable area in Al Muthanna totals 1,148.02 km² (2.22% of the governorate).
6.1 Major improvement processes
- Desert Greening: 247.43 km² (21.55% of non-stable; 0.48% of governorate).
- Ecological restoration: 106.57 km² (9.28% of non-stable; 0.21% of governorate).
- Vegetation Density gain: 61.51 km² (5.36% of non-stable; 0.12% of governorate).
- Wetland gain: 6.57 km² (0.57% of non-stable; 0.01% of governorate).
- Water gain: 6.20 km² (0.54% of non-stable; 0.01% of governorate).
- Ecological succession: 0.37 km² (0.03% of non-stable; 0.00% of governorate).
6.2 Major degradation processes
- Desertification: 272.66 km² (23.75% of non-stable; 0.53% of governorate).
- Cropland expansion: 231.46 km² (20.16% of non-stable; 0.45% of governorate).
- Urbanization: 90.31 km² (7.87% of non-stable; 0.17% of governorate).
- Vegetation Density Loss: 74.22 km² (6.46% of non-stable; 0.14% of governorate).
- Wetland Loss: 49.98 km² (4.35% of non-stable; 0.10% of governorate).
- Vegetation Type Simplification: 0.02 km² (0.00% of non-stable; 0.00% of governorate).

Figure 8. Land degradation and improvement type map in Al Muthanna Governorate, 2000–2020. (Full Resolution: Land degradation type map.JPG )
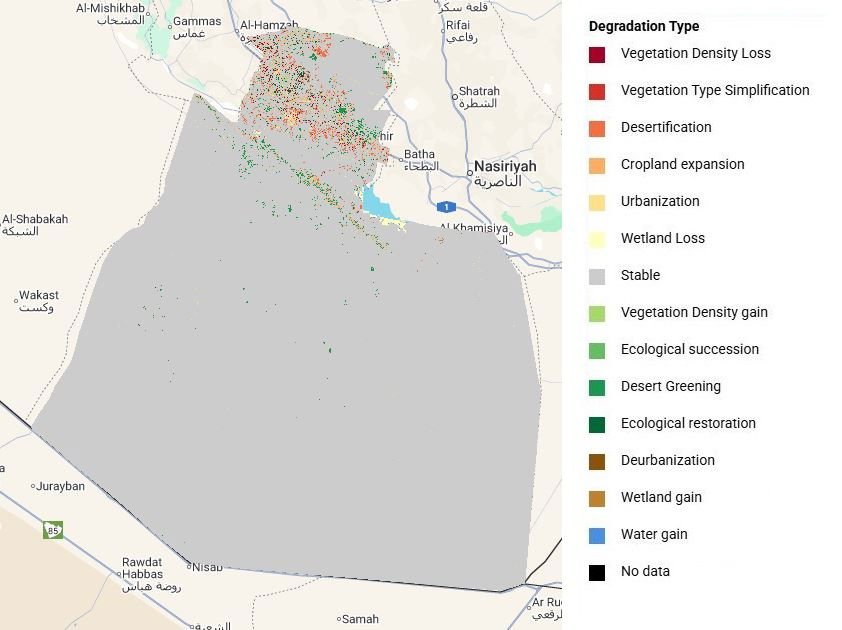
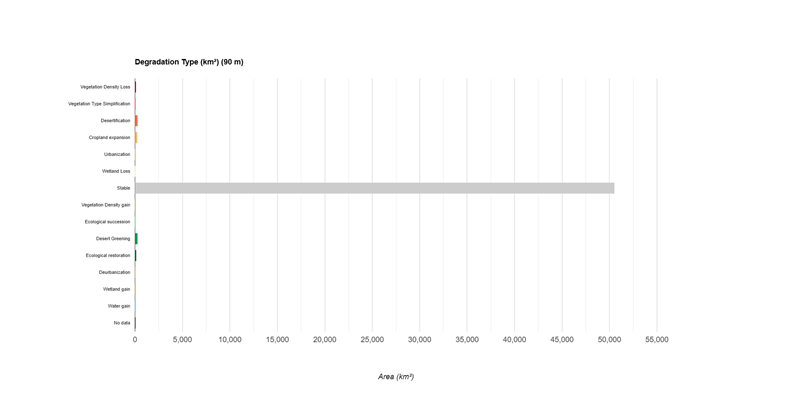
Figure 9. Land degradation and improvement types by area in Al Muthanna Governorate, 2000–2020. (Full Resolution: Land degradation type chart.png )
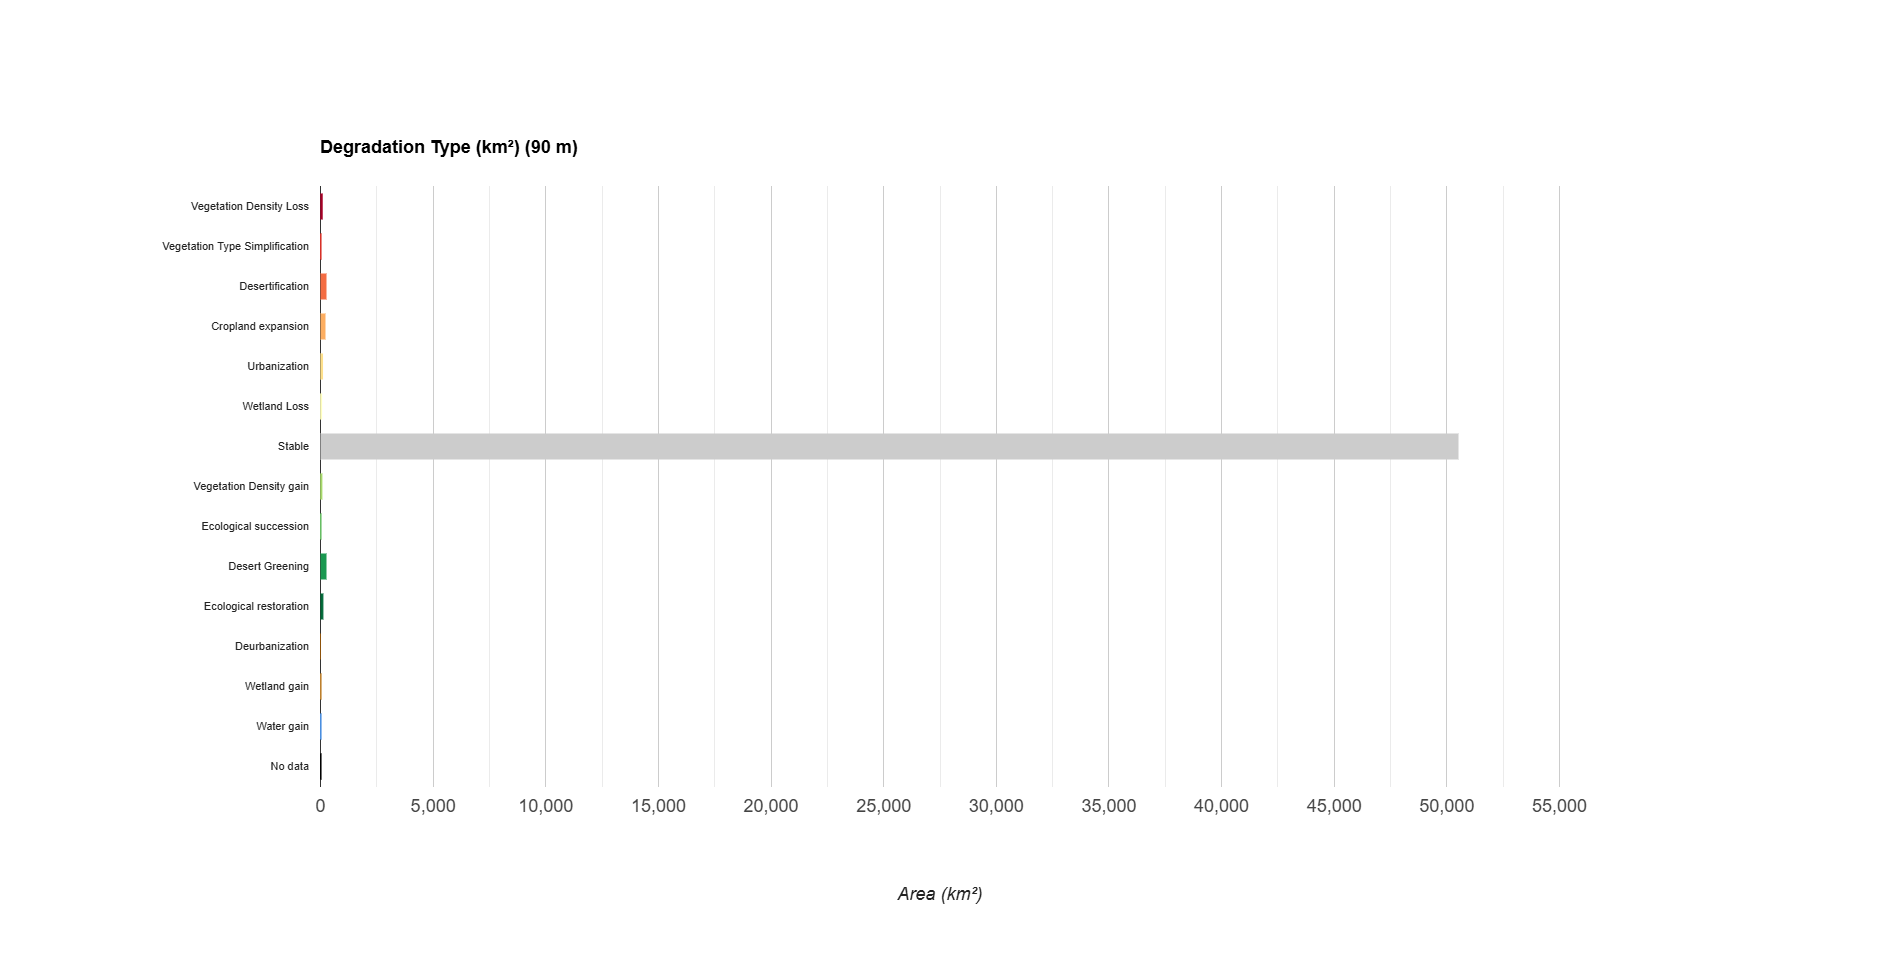
Table 5. Area of land degradation and improvement types in Al Muthanna Governorate, 2000–2020.
Class | Area (km²) | Share of governorate (%) |
Vegetation Density Loss | 74.22 | 0.14 |
Vegetation Type Simplification | 0.02 | 0.00 |
Desertification | 272.66 | 0.53 |
Cropland expansion | 231.46 | 0.45 |
Urbanization | 90.31 | 0.17 |
Wetland Loss | 49.98 | 0.10 |
Stable | 50,497.65 | 97.78 |
Vegetation Density gain | 61.51 | 0.12 |
Ecological succession | 0.37 | 0.00 |
Desert Greening | 247.43 | 0.48 |
Ecological restoration | 106.57 | 0.21 |
Wetland gain | 6.57 | 0.01 |
Water gain | 6.20 | 0.01 |
No data | 0.73 | 0.00 |
(Download: Land degradation type stats.csv)
7. Key messages for Al Muthanna
- The governorate remains overwhelmingly desert-dominated (>95%) in both 2000 and 2020.
- Land-cover change is limited and spatially concentrated in the northern part of the governorate.
- Cropland and built-up areas show small but measurable expansion over 2000–2020.
- Degradation and improvement are minor relative to the total area and occur in localized hotspots
Appendix A. Full land cover transition matrix (2000–2020)
Matrix entries are areas in km². Rows represent 2000 classes and columns represent 2020 classes. Abbreviations are defined below the table.
From\To | DES | LDG | MDG | HDG | SHR | FOR | WSV | WLD | WMD | WHD | WSH | WFO | WAT | SNI | CRP | BUI | NOD |
DES | 48,991.0 | 78.9 | 1.3 | 0.0 | 0.0 | 0.0 | 0.0 | 0.0 | 0.0 | 0.0 | 0.0 | 0.0 | 5.8 | 0.0 | 167.2 | 46.6 | 0.0 |
LDG | 225.0 | 890.8 | 54.8 | 0.7 | 0.0 | 0.0 | 0.0 | 0.0 | 0.0 | 0.0 | 0.0 | 0.0 | 0.3 | 0.0 | 188.1 | 29.8 | 0.0 |
MDG | 4.2 | 65.5 | 141.0 | 3.5 | 0.0 | 0.0 | 0.0 | 0.0 | 0.0 | 0.0 | 0.0 | 0.0 | 0.0 | 0.0 | 35.9 | 8.9 | 0.0 |
HDG | 0.1 | 0.8 | 6.6 | 11.9 | 0.0 | 0.1 | 0.0 | 0.0 | 0.0 | 0.0 | 0.0 | 0.0 | 0.0 | 0.0 | 7.2 | 2.2 | 0.0 |
SHR | 0.0 | 0.0 | 0.0 | 0.0 | 0.2 | 0.2 | 0.0 | 0.0 | 0.0 | 0.0 | 0.0 | 0.0 | 0.0 | 0.0 | 0.0 | 0.0 | 0.0 |
FOR | 0.0 | 0.0 | 0.0 | 0.0 | 0.0 | 0.1 | 0.0 | 0.0 | 0.0 | 0.0 | 0.0 | 0.0 | 0.0 | 0.0 | 0.0 | 0.0 | 0.0 |
WSV | 0.0 | 0.0 | 0.0 | 0.0 | 0.0 | 0.0 | 66.9 | 0.9 | 0.6 | 0.0 | 0.0 | 0.0 | 46.5 | 0.0 | 0.0 | 0.5 | 0.0 |
WLD | 0.0 | 0.0 | 0.0 | 0.0 | 0.0 | 0.0 | 0.8 | 3.2 | 0.9 | 0.0 | 0.0 | 0.0 | 2.0 | 0.0 | 0.3 | 0.5 | 0.0 |
WMD | 0.0 | 0.0 | 0.0 | 0.0 | 0.0 | 0.0 | 0.0 | 0.4 | 1.0 | 0.1 | 0.0 | 0.0 | 0.4 | 0.0 | 0.2 | 0.1 | 0.0 |
WHD | 0.0 | 0.0 | 0.0 | 0.0 | 0.0 | 0.0 | 0.0 | 0.0 | 0.1 | 0.4 | 0.0 | 0.0 | 0.0 | 0.0 | 0.1 | 0.0 | 0.0 |
WSH | 0.0 | 0.0 | 0.0 | 0.0 | 0.0 | 0.0 | 0.0 | 0.0 | 0.0 | 0.0 | 0.0 | 0.0 | 0.0 | 0.0 | 0.0 | 0.0 | 0.0 |
WFO | 0.0 | 0.0 | 0.0 | 0.0 | 0.0 | 0.0 | 0.0 | 0.0 | 0.0 | 0.0 | 0.0 | 0.0 | 0.0 | 0.0 | 0.0 | 0.0 | 0.0 |
WAT | 0.6 | 0.0 | 0.1 | 0.1 | 0.0 | 0.0 | 4.3 | 0.9 | 0.8 | 0.3 | 0.0 | 0.0 | 16.2 | 0.0 | 0.2 | 0.3 | 0.0 |
SNI | 0.0 | 0.0 | 0.0 | 0.0 | 0.0 | 0.0 | 0.0 | 0.0 | 0.0 | 0.0 | 0.0 | 0.0 | 0.0 | 0.0 | 0.0 | 0.0 | 0.0 |
CRP | 42.8 | 83.1 | 22.1 | 1.3 | 0.0 | 0.0 | 0.0 | 0.1 | 0.0 | 0.0 | 0.0 | 0.0 | 0.0 | 0.0 | 301.3 | 2.5 | 0.0 |
BUI | 0.0 | 0.0 | 0.0 | 0.0 | 0.0 | 0.0 | 0.0 | 0.0 | 0.0 | 0.0 | 0.0 | 0.0 | 0.0 | 0.0 | 0.0 | 73.8 | 0.0 |
NOD | 0.0 | 0.0 | 0.0 | 0.0 | 0.0 | 0.0 | 0.0 | 0.0 | 0.0 | 0.0 | 0.0 | 0.0 | 0.0 | 0.0 | 0.0 | 0.0 | 0.0 |
(Download: Al Muthanna Transition Matrix.csv)
Abbreviations: DES=Desert, LDG=Low-Density Grassland, MDG=Medium-Density Grassland, HDG=High-Density Grassland, SHR=Shrubland, FOR=Forest, WSV=Wetland with sparse vegetation, WLD=Wetland with Low-Density Grass, WMD=Wetland with Medium-Density Grass, WHD=Wetland with High-Density Grass, WSH=Wetland with Shrubs, WFO=Wetland with Forest, WAT=Water, SNI=Snow/Ice, CRP=Cropland, BUI=Built-up, NOD=No data