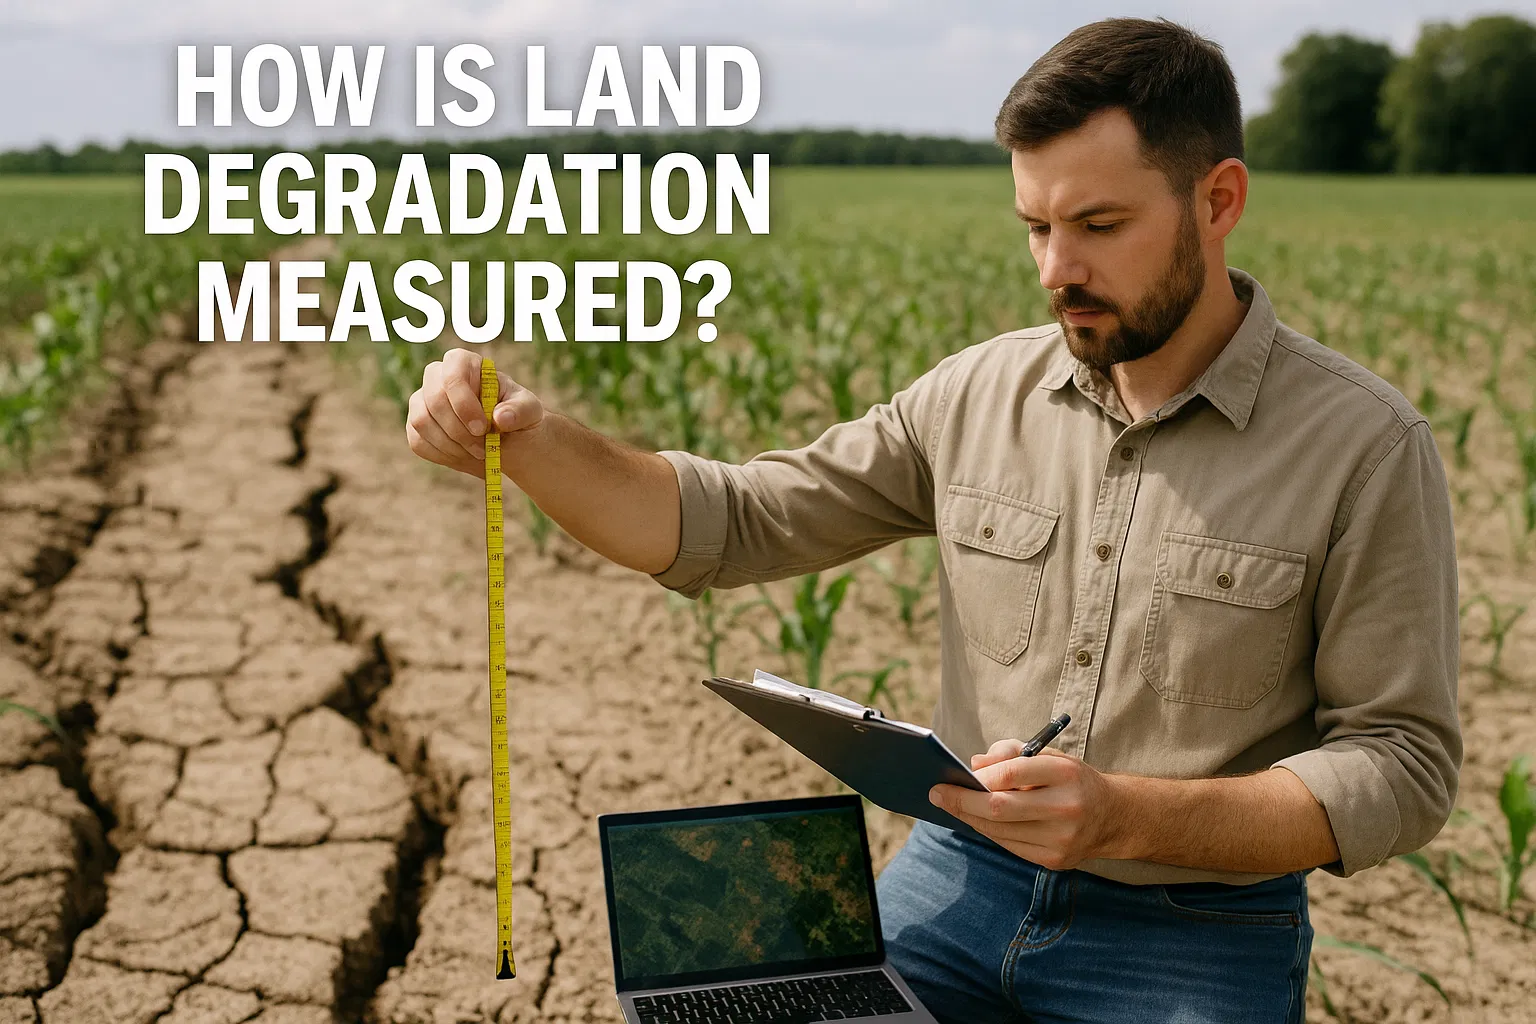
📏 How do we monitor land degradation?
Land degradation—the gradual loss of land’s biological or economic productivity and complexity—sits at the heart of global sustainability efforts. As defined by the United Nations Convention to Combat Desertification (UNCCD):
“the reduction or loss of the biological or economic productivity and complexity of rain-fed cropland, irrigated cropland, or range, pasture, forest and woodlands resulting from a combination of pressures, including land use and management practices.” (UNSD)
The global community tracks progress on this front via SDG 15 (“Life on Land”), specifically Target 15.3, which calls for:
“By 2030, combat desertification, restore degraded land and soil, including land affected by droughts, floods and desertification, and strive to achieve a land-degradation-neutral world.” (sdgs.unep.org)
The indicator used is SDG 15.3.1: the proportion of land that is degraded over total land area. In simple terms: how much of a country’s land is considered degraded, compared to how much land the country has. (UN-GGIM Europe)
Why measuring land degradation is complex
- Land degradation is multifaceted: it involves physical, biological, chemical and economic dimensions. A single metric cannot capture everything. (MDPI)
- Degradation can be slow (e.g., gradual reduction in soil carbon) or fast (e.g., deforestation).
- Data availability, scale (local vs global) and definitions vary across countries.
- Because of these challenges, the monitoring approach focuses on three sub-indicators (see below) and applies a “binary” logic (degraded vs not-degraded) to each land unit. (UNSD)
The three sub-indicators
To operationalize SDG 15.3.1, the methodology uses three complementary sub‐indicators:
- Land cover and land cover change – how land use/cover has changed (e.g., forest to cropland, grassland to built-up). (UN-GGIM Europe)
- Land productivity – trends in how much biomass or net primary production (NPP) the land yields over time. A persistent decline may indicate degradation. (MDPI)
- Carbon stocks above and below ground – for now often represented by soil organic carbon (SOC) and vegetation biomass. Losses here hint at loss of land quality. (UN-GGIM Europe)
These three together give a rounded view: cover (what’s on the land), productivity (what it yields) and carbon (a key indicator of land health).
The “One-Out, All-Out” (1OAO) logic
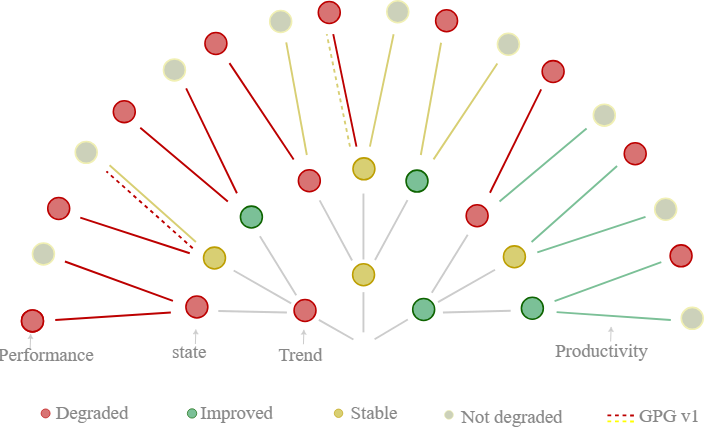
Here is a key methodological point: for each land unit under assessment, the status is labelled “degraded” if any one of the three sub-indicators shows a negative or deteriorating trend (or remains degraded if previously degraded). That is: one out ⇒ all out. (UNSD)
- If land cover change shows degradation → degraded.
- If productivity declines → degraded.
- If carbon stock drops → degraded.
- If none show decline (i.e., all stable or improving) → not-degraded.
This simplifies classification, but also means the method errs on the side of caution: a single weak signal triggers classification as degraded.
Step-by-step methodology
Here’s a breakdown of how the indicator is typically computed:
- Define baseline period – For many reporting frameworks the baseline period is often around 2000–2015 (with 2015 being a key reference year). (UN-GGIM Europe)
- Collect data for each sub-indicator– e.g.:
- Land cover maps (global/regional/national)
- Vegetation productivity time series (NDVI/EVI, derived NPP)
- Soil organic carbon maps or other carbon stock proxies
(Global datasets are available; national data may be better where available) (CEOS)
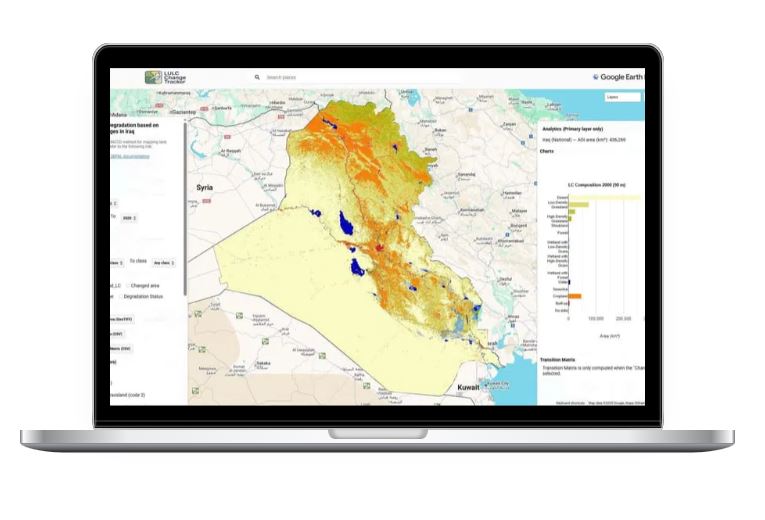
- Compute trends for each sub-indicator – e.g.: productivity trend via Mann-Kendall test; land cover change via transition matrices; carbon stock change via available SOC maps. (docs.sepal.io)
- For each land unit (grid cell, pixel, administrative unit) apply 1OAO logic → determine degraded / not degraded.
- Aggregate – Sum the area of land units classified as degraded, divide by total land area (excluding inland waters) → the indicator: proportion degraded. (UNSD)
- Compare baseline vs reporting period – Allows tracking change (increase or decrease in degraded land) over time. (unccd.int)
Data sources & resolution matters
- Many countries rely on global satellite datasets (e.g., ESA CCI Land Cover, MODIS, Sentinel) where national data are unavailable. (sdgs.unep.org)
- Higher‐resolution national datasets improve accuracy (especially for land cover transitions) but may require more processing. (MDPI)
- Soil organic carbon and biomass stock data remain challenging globally (varying resolution, uncertainty).
- Temporal resolution (how many years, how frequent) and spatial resolution (pixel size) matter: finer resolution gives more local relevance, but may reduce comparability globally.
Interpretation & caveats
- Proportion degraded gives a headline figure, but does not say everything: it doesn’t capture severity of degradation, only presence of it via the sub‐indicators.
- Because of 1OAO logic, if any sub-indicator is negative, the land is marked degraded — this could mask nuance (e.g., slight dip in productivity vs major erosion).
- National definitions, local contexts, data quality and timing vary — so the figure needs to be complemented by local monitoring and ground data. (UN-GGIM Europe)
- Improvements (restoration) must show reversal of the negative signal in the sub‐indicator(s) to change classification from “degraded” → “not degraded”. Once marked degraded, land remains so unless there’s evidence of improvement (UNSD)
Why this matters
Measuring land degradation consistently helps:
- Anchor policy efforts (restoration, sustainable land management) in evidence.
- Track progress toward global goals (Target 15.3).
- Reveal where land is at risk, supporting pre-emptive action.
- Connect to other issues: food security, climate (via carbon stocks), biodiversity.
Summary
In sum: measuring land degradation via SDG 15.3.1 involves gathering data on land cover changes, productivity trends and carbon stock changes; applying a “one‐out, all‐out” logic to classify land units; and calculating the proportion of land flagged as degraded relative to land area. It’s not perfect — but offers a globally consistent, scalable way to monitor one of the major environmental challenges of our time.
References
- UN Stats. Metadata for SDG Indicator 15.3.1: Proportion of land that is degraded over total land area. “Good Practice Guidance v2.0” etc. (UNSD)
- UN-GGIM Europe Working Group. Guidelines for SDG Indicator Calculation 15.3.1. (UN-GGIM Europe)
- UNEP. “SDG Indicator 15.3.1: Proportion of land that is degraded over total land area.” (sdgs.unep.org)
- Ghosh A. et al. “Monitoring SDG Indicator 15.3.1 on Land Degradation Using SEPAL: Examples, Challenges and Prospects.” Land. 2024. (MDPI)
- FAO. Measuring land degradation. (FAOHome)
More details on the methodology can be found through:
https://docs.sepal.io/en/latest/modules/dwn/sdg_indicator.html